A thermal drone flight over a solar plant produces thousands of raw frames. On their own they tell an operator very little. Somebody, or something, has to build a map from them, find every panel on it, measure each panel, decide which deviations are real, name each anomaly and write it down where a field team can find it.
That chain is what solar thermal inspection software does. This article walks through it as it runs on the SolarDetech platform, where processing after approval runs without human intervention and an expert confirms the class of every anomaly, and says plainly where the pipeline starts and where it stops.
What the software starts from
The input is one flight over the whole plant: radiometric thermal frames and RGB frames, captured at 30 m by a drone with RTK positioning, on flight lines that cross the panel rows. Radiometric means every pixel carries a temperature value, not only a colour. RTK means the position of every frame is known precisely enough to stitch long rows without drift. The route does not start before RTK is FIXED.
The conditions of the flight are part of the input too. A thermal difference only appears when the panels are under load, so the flight is made on a clear day at no less than 600 W/m² irradiance. The platform checks the irradiance, wind and cloud cover of the flight hours against the IEC TS 62446-3 thresholds and flags a condition outside its threshold openly. The same conditions are written into the report.
SolarDetech approves every inspection. Approval covers data acceptance and the upload link. Processing after approval is fully autonomous. The data goes through the same checks whether our team flew or yours.
Step 1: orthomosaic and acceptance check
The frames are merged into one georeferenced orthomosaic of the plant, with a thermal layer and an RGB layer on the same map. Before anything is measured, the orthomosaic passes an automatic acceptance check on four points.
- Coverage: the whole site is on the map.
- Row continuity: panel rows join on the map without breaks.
- Brightness uniformity: brightness is consistent from frame to frame.
- Edge crispness: panel edges are sharply resolved.
Data that misses the standard is not processed. This is what 100% panel coverage means on the platform: the whole plant is flown, every panel is measured and recorded, and a flight with gaps does not go on to produce a partial report. Coverage is the share of panels measured. It is not a detection accuracy figure.
Step 2: panel segmentation and persistent identity
Image segmentation finds every module in the plant one by one and records its outline. Each panel then gets an address on the map: block, row and table, plus its tier and column within the table. Its electrical position (transformer, inverter, combiner, string) sits on the same record.
The identity is persistent. On the next flight the same physical panel keeps the same identity, so its measurements, findings and work orders build up in one record instead of being counted again from scratch. That record is the panel-level digital twin, and it is what the rest of the SolarDetech platform is built on.
Step 3: measurement
Each panel's temperature difference is measured against its neighbours and normalised to irradiance. A panel that deviates measurably from its peers is flagged. Runs of several adjacent panels that are uniformly warm are detected as a pattern of their own, because they usually point to a string or another electrical cause rather than to a single cell.
Comparing a panel with its neighbours, instead of reading an absolute temperature, is what keeps the result stable. Air temperature, wind and the irradiance at the moment of capture move every panel in a row together. A deviation from the neighbours does not move with them.
A finding has to be verified before it enters the report: the same anomaly must be measured consistently in more than one raw frame of the same panel. A flare that shows in one frame only, from a reflection or a passing shadow, is discarded. Each finding stays traceable to the raw radiometric frame it came from. The three verification rules are set out on the methodology page.
Step 4: classification and priority
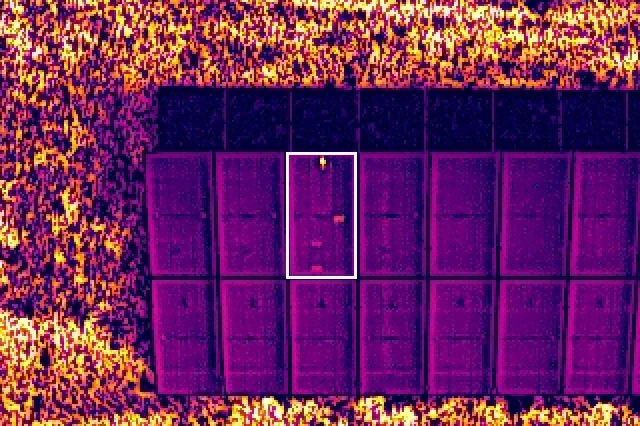
A classification model names the type of every finding from 17 anomaly classes and sets its priority: Very high, High, Medium or Low. The thermal classes include single and multiple hot cells, hot spots, bypass diode and substring patterns, offline modules, string faults, junction box heating and reversed polarity. The RGB classes include glass breakage, missing or detached modules, soiling, bird droppings, biological growth and shading.
Priority weighs safety as well as production loss. Anomalies that can carry fire risk (junction box heating, string faults with arc traces, advanced hot spots) go to the top of the list with very high priority. Every anomaly also comes with its probable root cause and an estimated annual production loss, so the list can be sorted by what to fix first.
Step 5: report and record
The output is two things. The first is the report: an executive summary, the inspection conditions, the method, the loss analysis, site observations, findings maps, the complete anomaly index and a card for every finding with its class, priority, location and measured temperature difference.
The second is the platform record. Every finding is written onto the panel it belongs to, on the plant map, where it opens down to the raw thermal and RGB frames. From there a finding becomes a work order, is assigned, tracked and closed, and a fixed anomaly closes on the same panel record at the next inspection.
Automatic processing takes about 12 hours for a 10 MW plant, and a 50 MW plant is processed in about 2 days. The report is delivered within at most 5 business days after the data enters the system.
What fully autonomous covers, and what it does not
Orthomosaic building, panel segmentation, measurement and anomaly detection run without human intervention. The model assigns each anomaly one of 17 classes, and an expert confirms it before the report. Before them sits approval, which covers data acceptance and the upload link.
Some things sit outside the pipeline altogether. The software works on thermal and RGB imagery. I-V curve and insulation measurement are offered optionally through a solution partner, inverter faults are followed through SCADA, and SCADA and inverter data can optionally be integrated. Panel serial numbers are entered by scanning the label with a camera (OCR).
The pipeline is hardware-agnostic. It works with RTK drones carrying a radiometric thermal camera, flown by our team anywhere in Türkiye or by your own team, and data from plants outside Türkiye is accepted. The FAQ answers the common questions on own-drone use, delivery times and what the platform costs.
Five questions to ask of any solar thermal inspection software
- Does a flight with coverage gaps still produce a report?
- Is the measurement normalised to irradiance and compared with neighbouring panels?
- Is each finding verified in more than one raw frame, and can you open that frame?
- Are the flight conditions written into the report?
- Does a panel keep the same identity from one flight to the next?
If every answer is yes and written down, the output is an inspection record you can act on and compare next year. To put your plant on the platform, send us your panel count and location. We reply within 24 hours with a quote. The platform itself is free; the inspection is priced by quote for your site.