IEC TS 62446-3 compliant
Every panel in your plant, thermally inspected.
Recover your production loss.
In a single flight every panel in your plant is measured. Every anomaly found is listed with its type, its priority and its position, which row, which table and which panel.
- 30 mflight altitude
- ≥ 5×5 pxresolution per cell
- RGB + thermaltwo channels
- 17 classesanomaly classes
- 24 hoursto a rate-stamped quote
- One flightthe whole site, every panel
Catch anomalies while they are small.
One flight measures every panel in your plant from dozens of angles, on an AI-assisted pipeline. Every finding comes out with its type, its priority and its estimated annual production loss. Monitoring systems cannot give you this, because they measure at inverter or string level. Panel-level losses can stay hidden inside those totals for years.
An anomaly found early stays small, and the loss does not stretch over years.
01
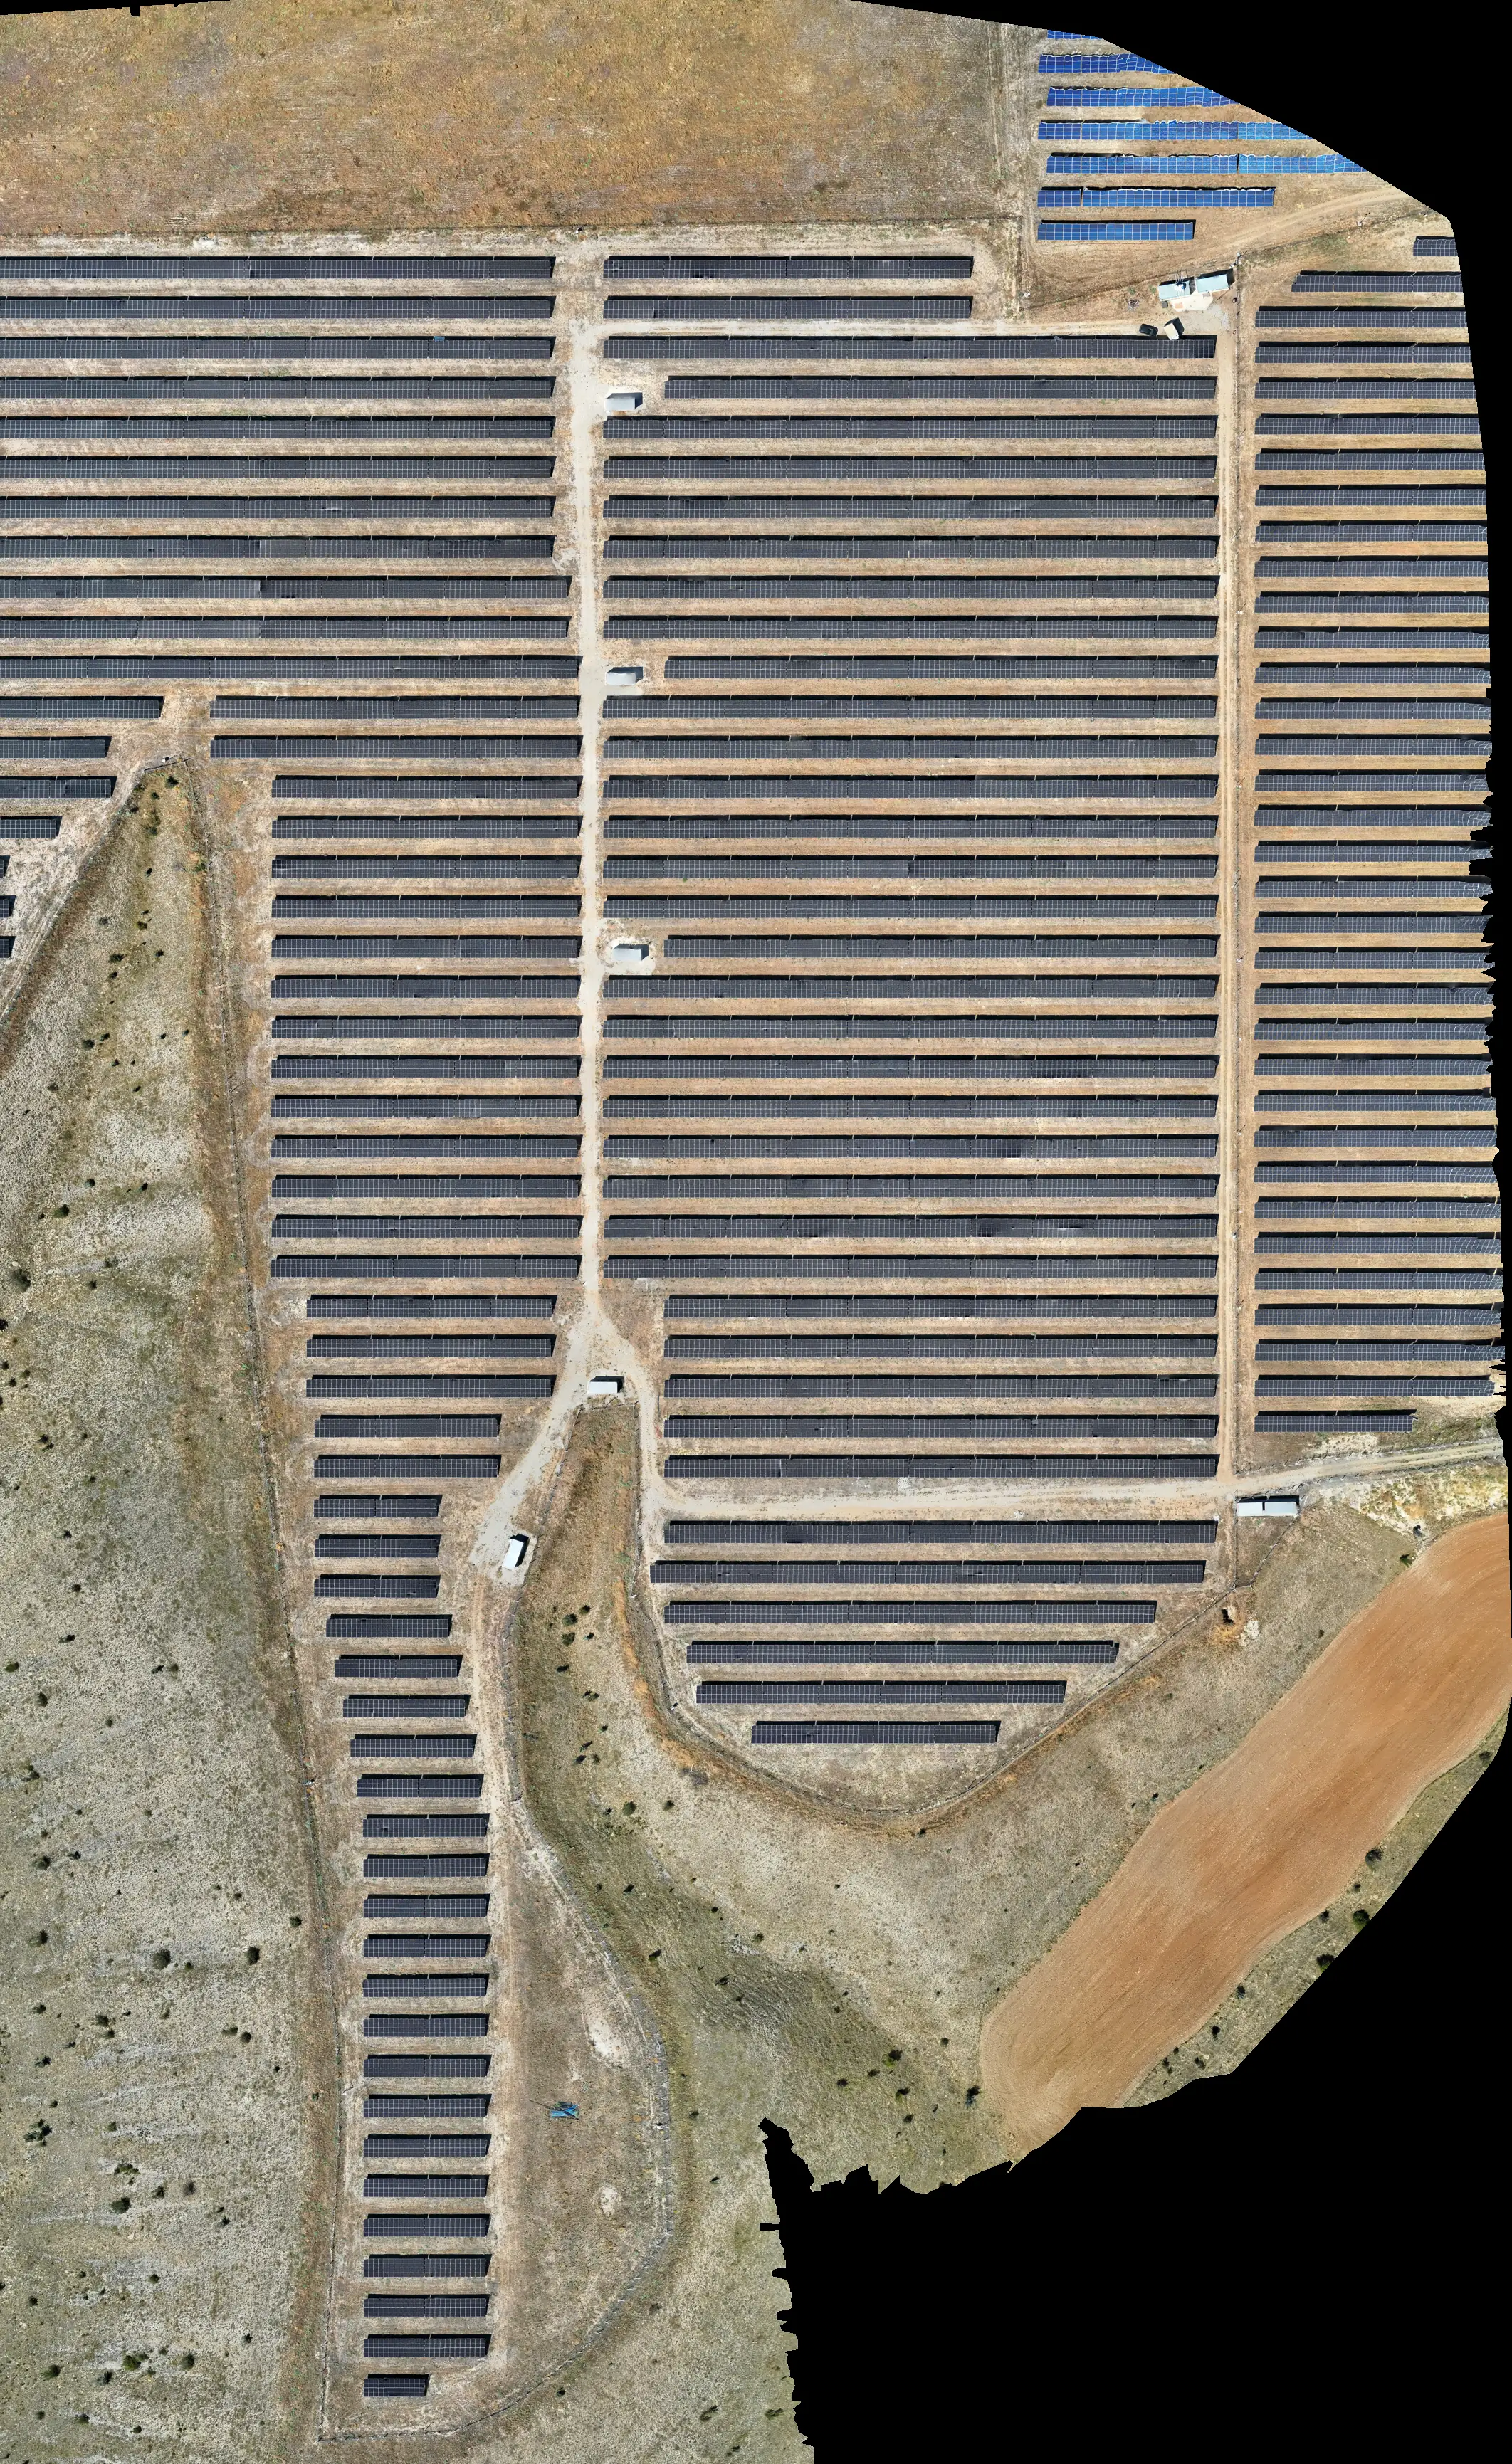
The frames from the flight are stitched into one map
The frames from the flight are stitched into a single map covering the whole plant. The map fixes where every panel sits on the site and gives it its identity.
02
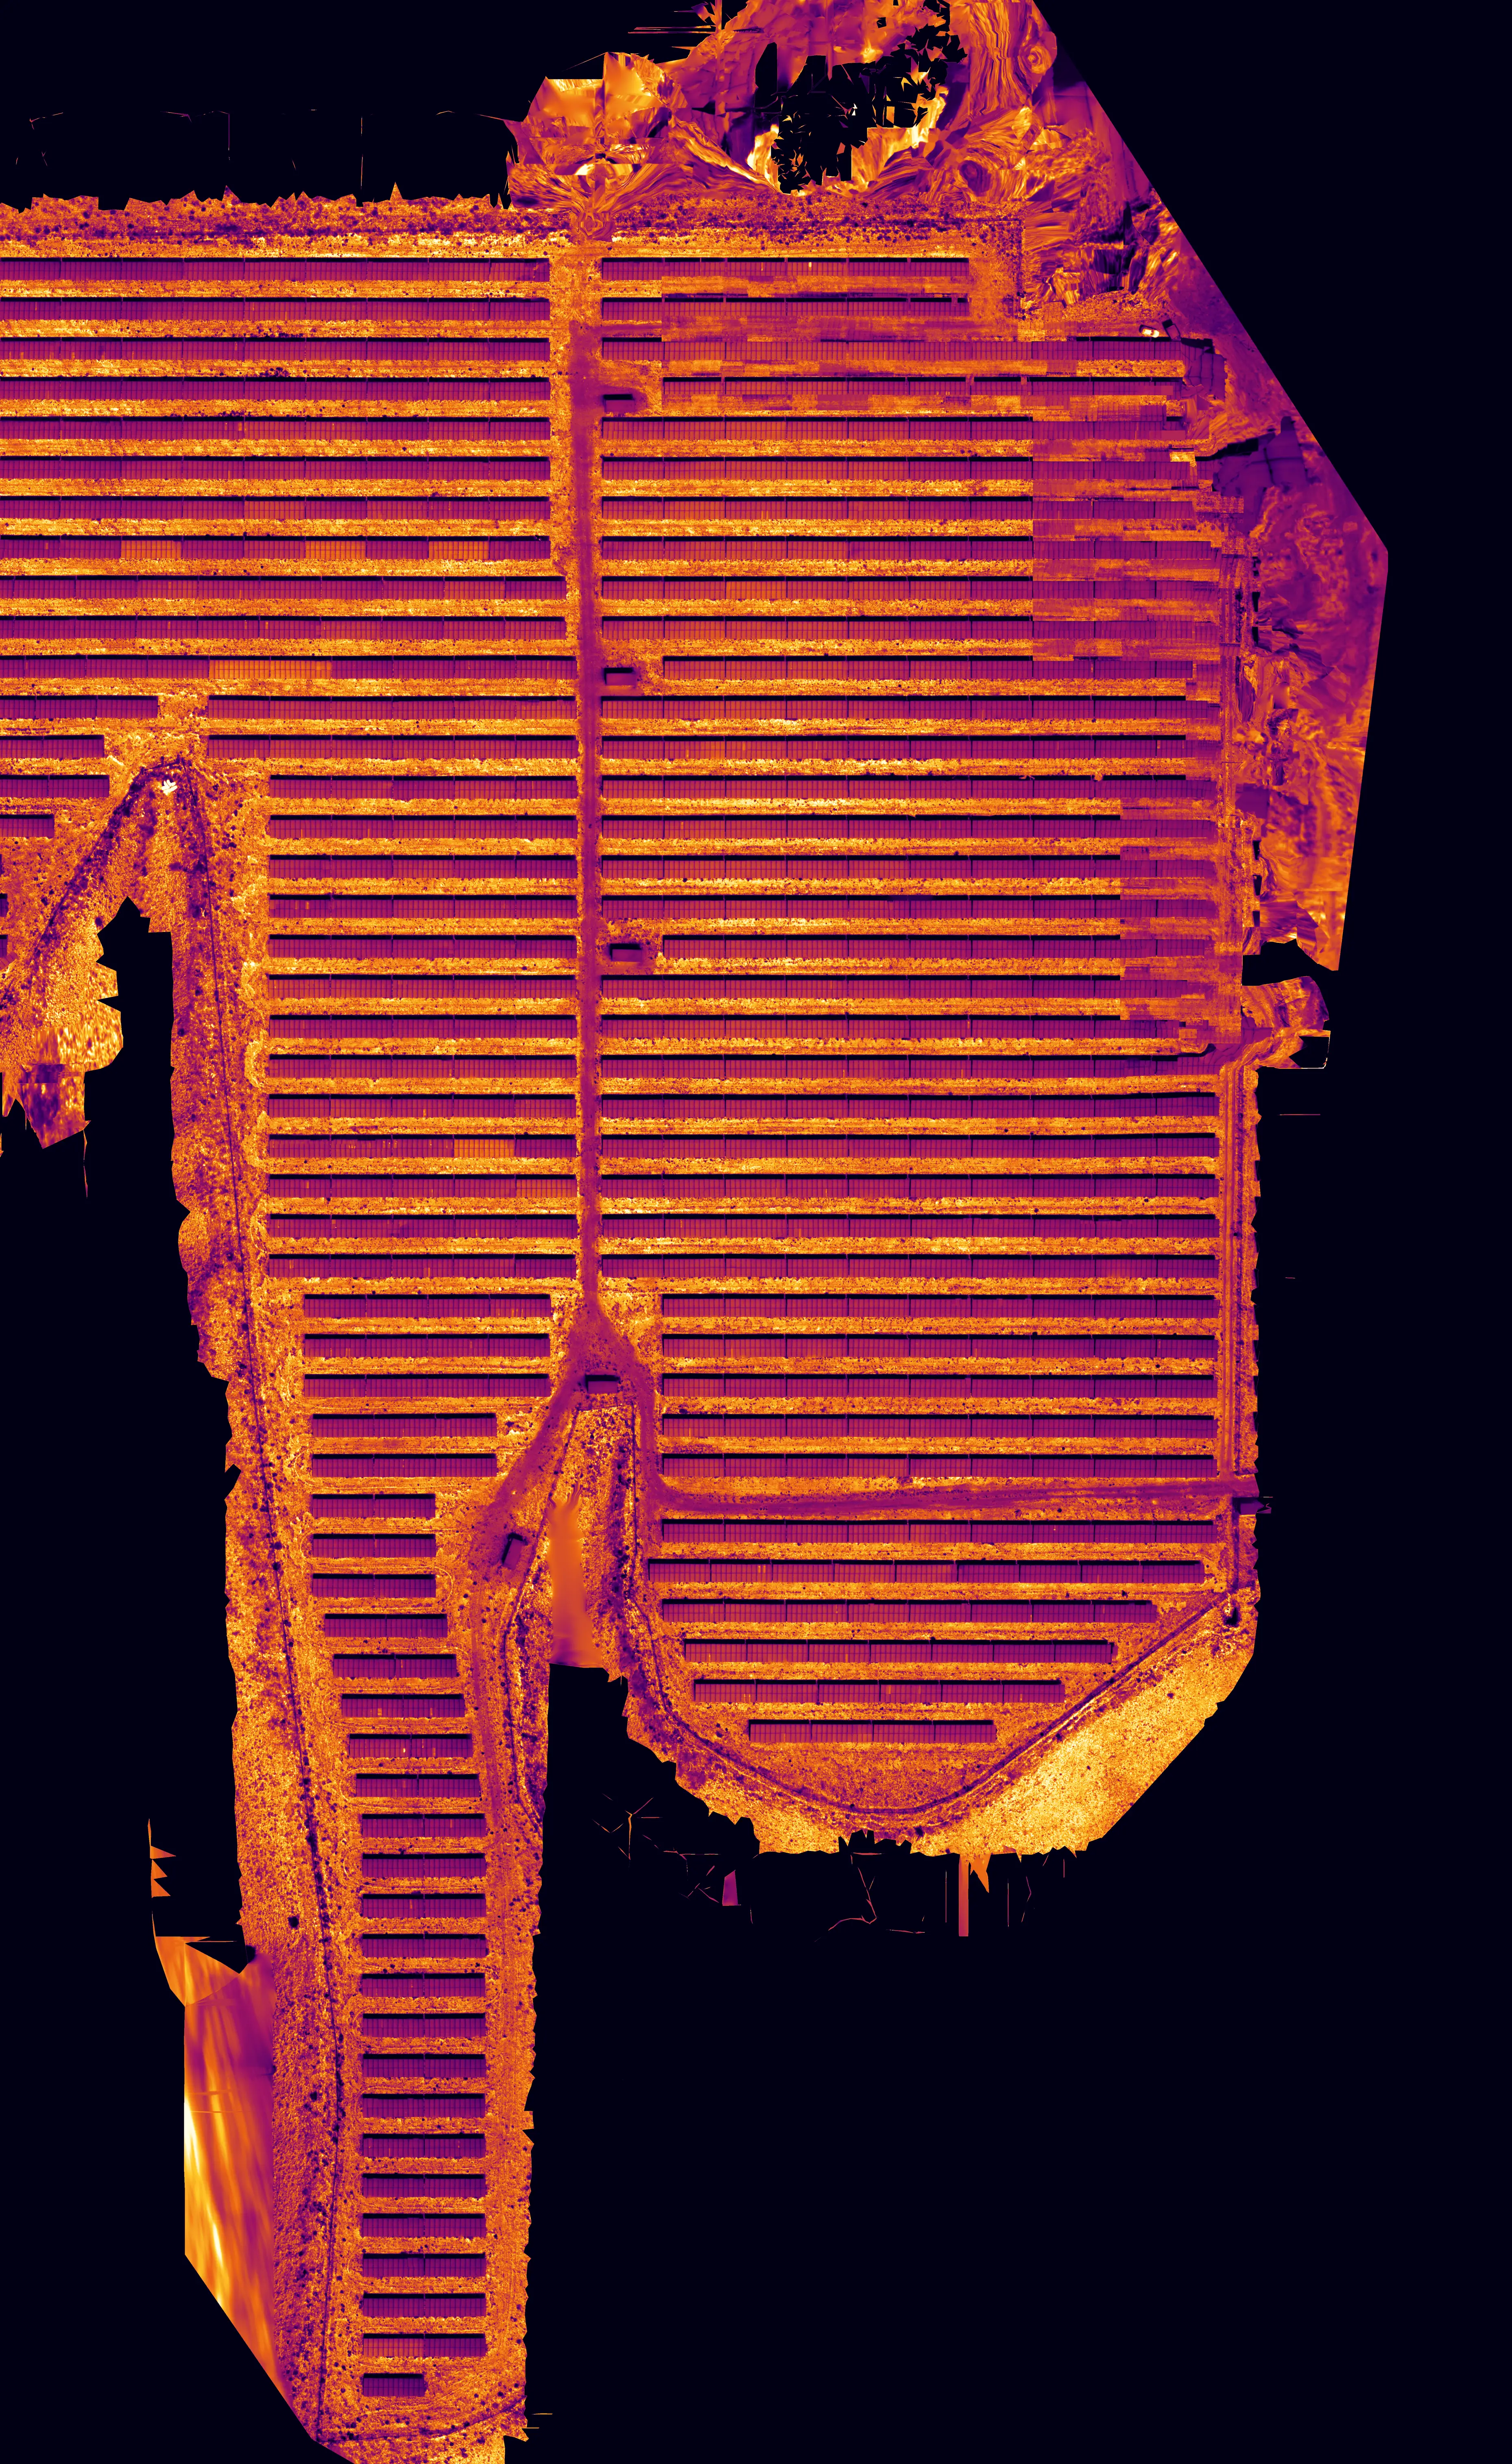
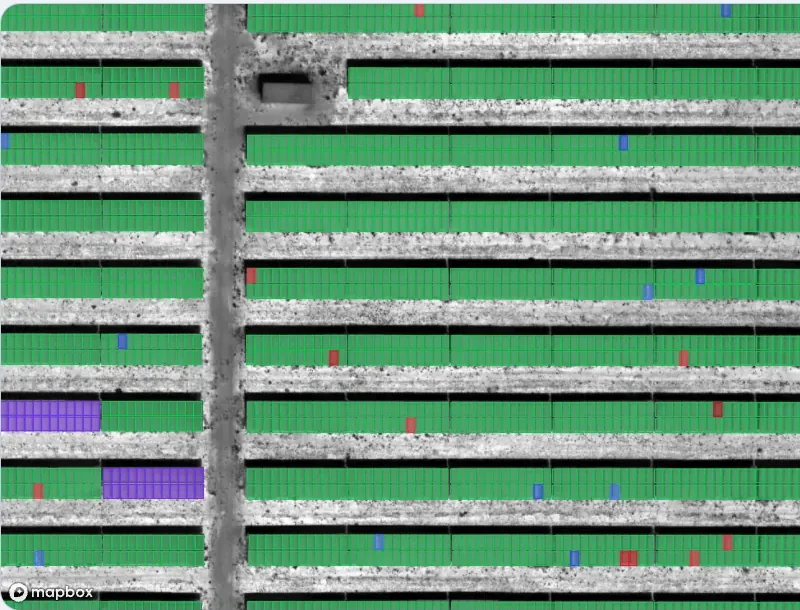
The whole plant is shown in a single thermal map
The temperature map sits on the same pixel grid as the visible-light map. Temperature differences are visible directly on the map.
03
AI finds every panel
Image segmentation detects every module in the plant one by one. Each module's outline is recorded together with its row, table, tier and column position.
04
Measurement flags the anomaly
Each module's temperature difference, normalised to irradiance, is compared with its neighbours. Panels that deviate from their neighbours are flagged.
05
Model names the anomaly type
A classification model names the type of every finding from the 17 anomaly classes and prioritises it.
06
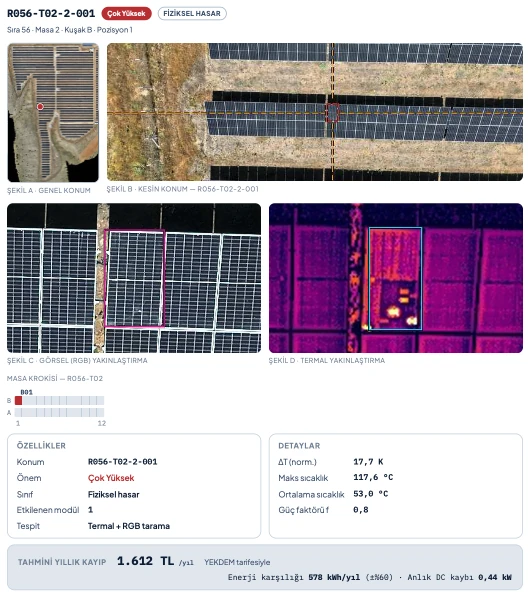
A separate page is prepared for every finding
The page holds the finding's position, its RGB and thermal close-ups, its class, the number of modules affected and its estimated annual loss. Every finding is verified across several images.
07
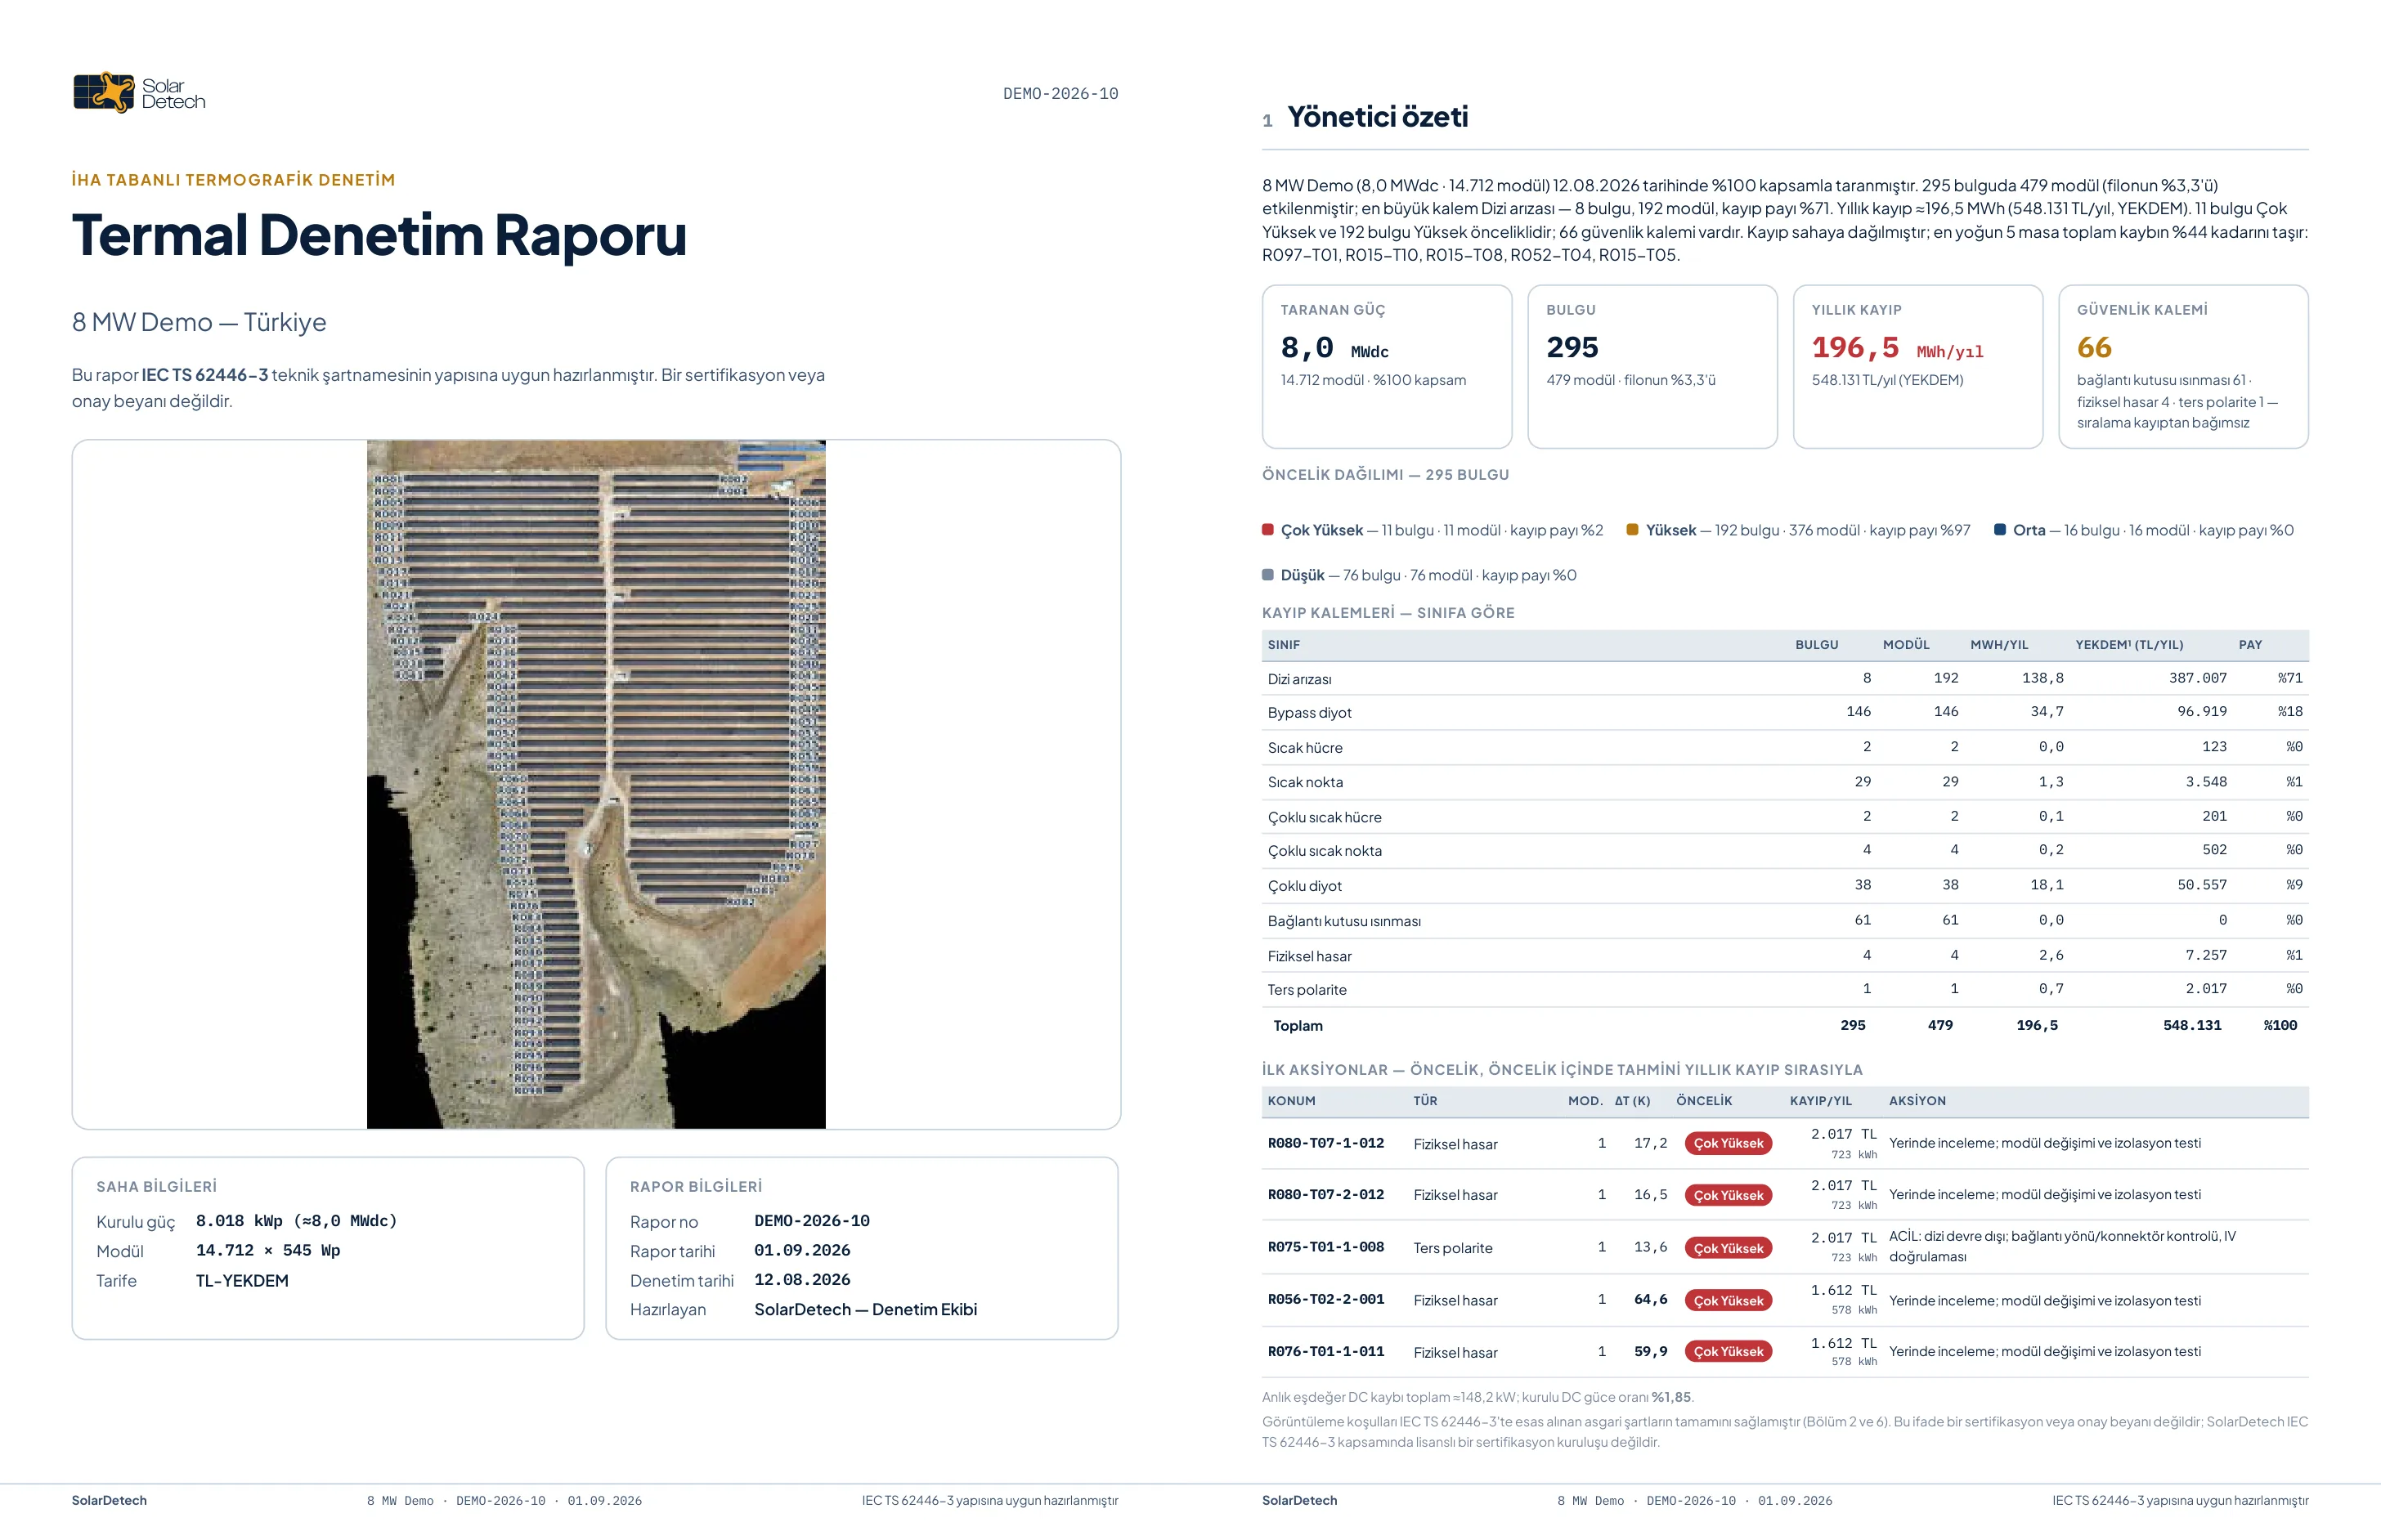
The report is prepared after the flight
An inspection report is prepared. The same findings also open in your plant's digital record. Every inspection is written onto the same panel identities, and every panel builds a temperature history. We recommend one inspection a year.
What is delivered after a flight
The report states for every anomaly which row, which table and which panel it is in, its type and its priority. Your plant's digital record, panel by panel, is delivered with it.
- 01
Orthomosaic mapping
A single stitched map of the whole plant.
The whole site
- 02
Panel-level record
For every panel, its position, the measured temperature difference and its deviation from its neighbours.
Platform
- 03
Prioritised anomaly list
Findings with their type named and prioritised. Every finding is verified across several images.
17 anomaly classes
- 04
Production loss analysis
The estimated annual production loss for every finding.
Per finding
- 05
Inspection report
A summary section for investor and operator, followed by the technical finding list.
One report per flight
- 06
Digital record, panel by panel
Every panel is on the platform under its own identity. You locate the finding on the map, turn it into a work order and write the closing note. Every inspection is added to the same panel record. A resolved anomaly closes at the next inspection.
Fleet · map · panel record
Your request reaches us by email. Within one business day we send an invitation to the sample site.
Request a demo accountWhat we detect
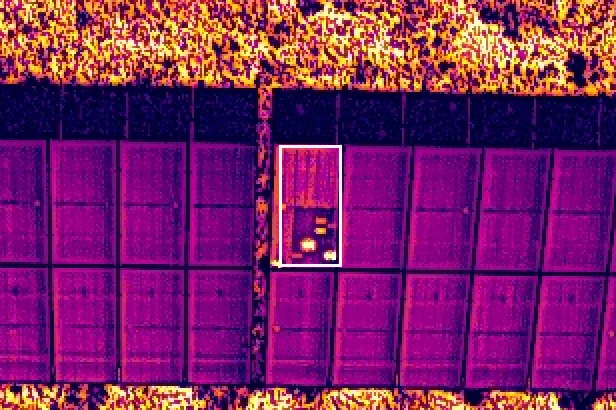
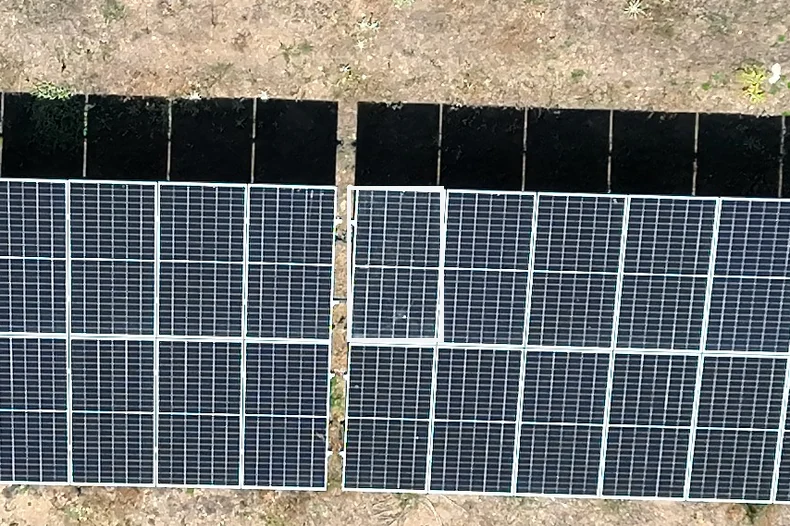
Each of the seventeen anomaly classes is shown with a real cut from a delivered inspection. Priority looks at safety as well as production loss.
 THERMAL
 RGB
RGB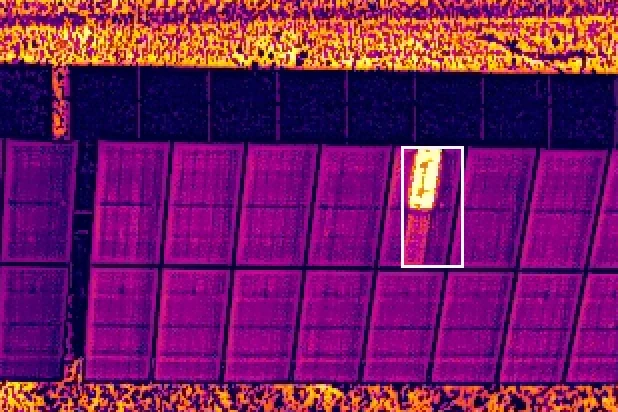
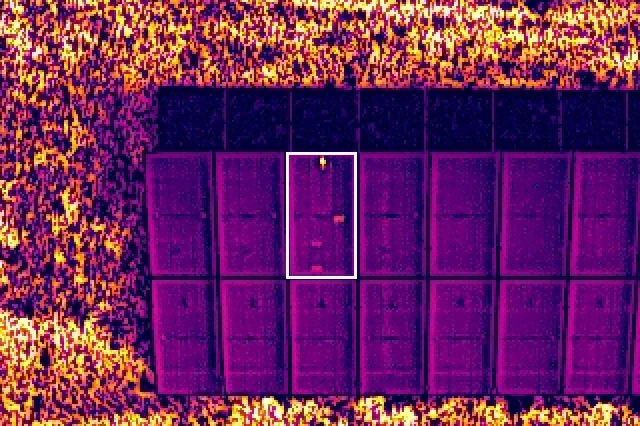
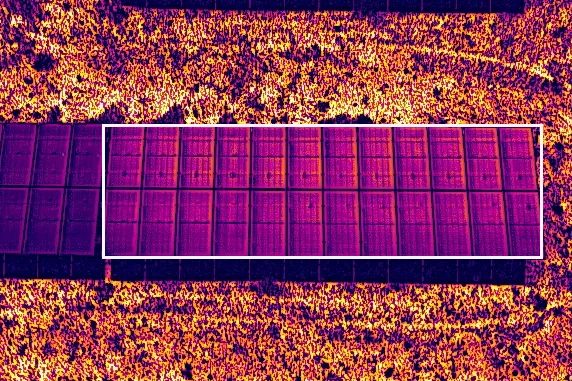
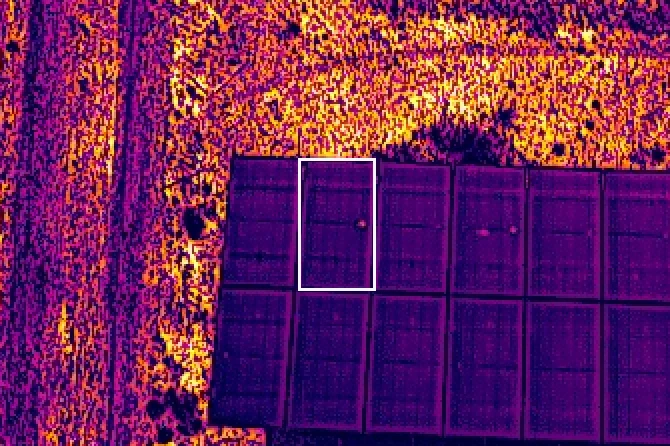
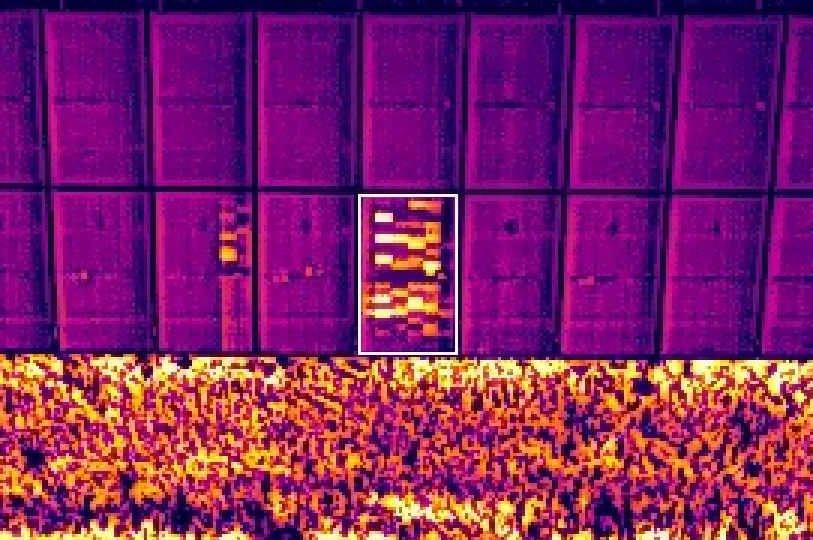
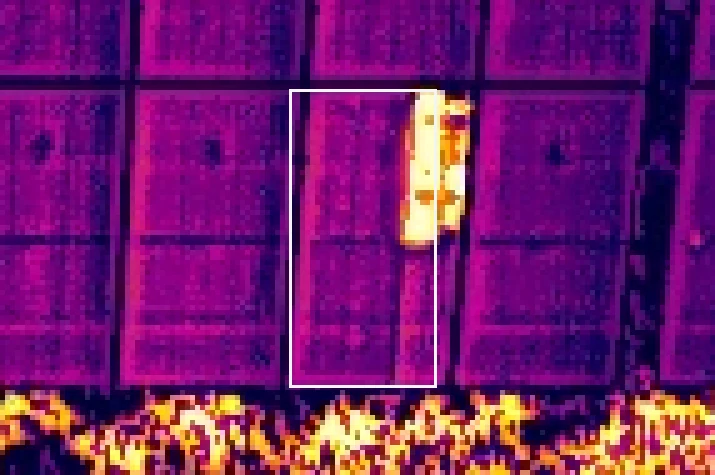
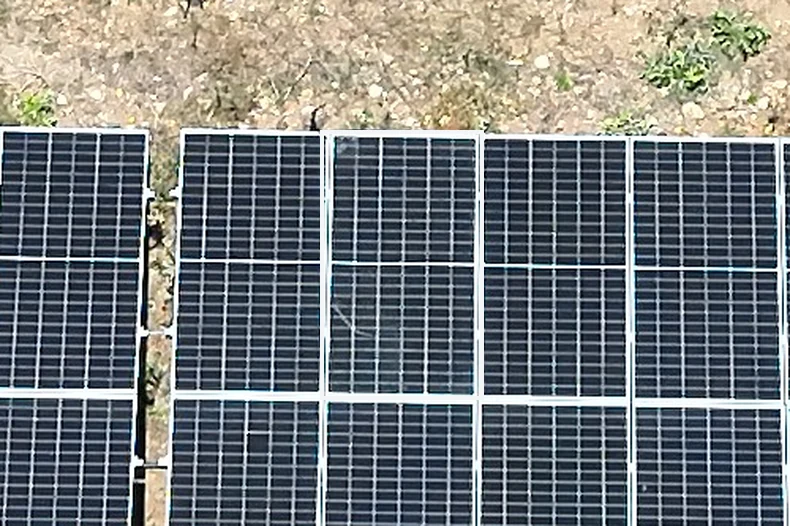
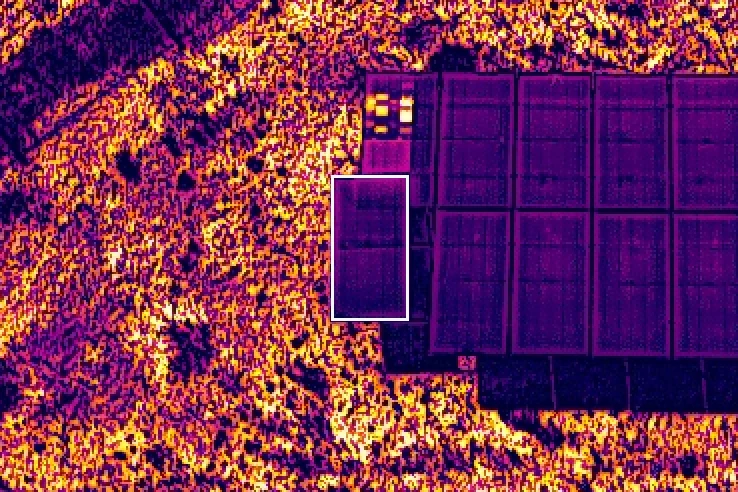
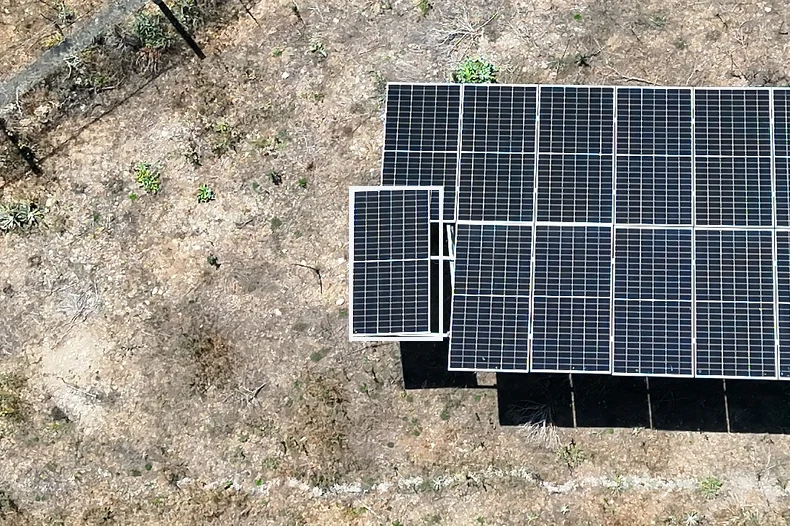
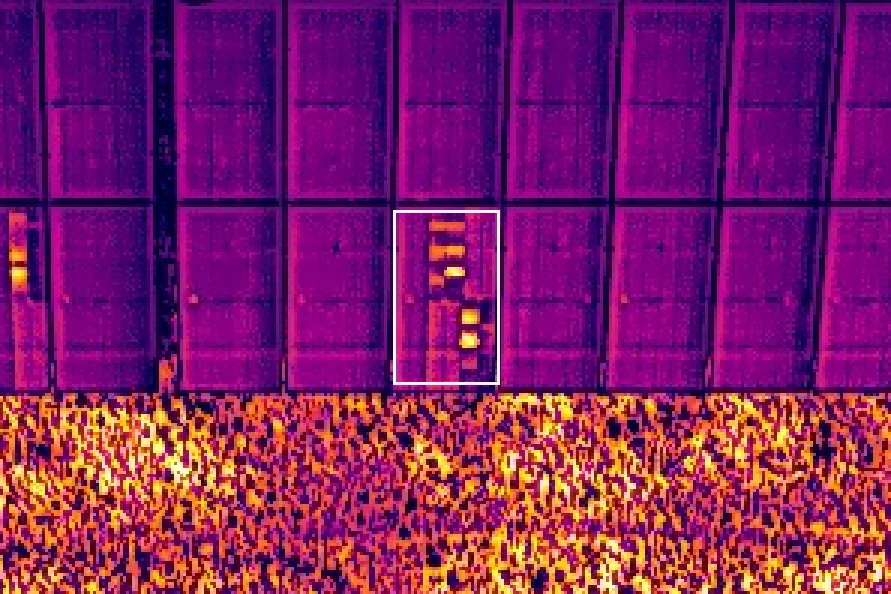
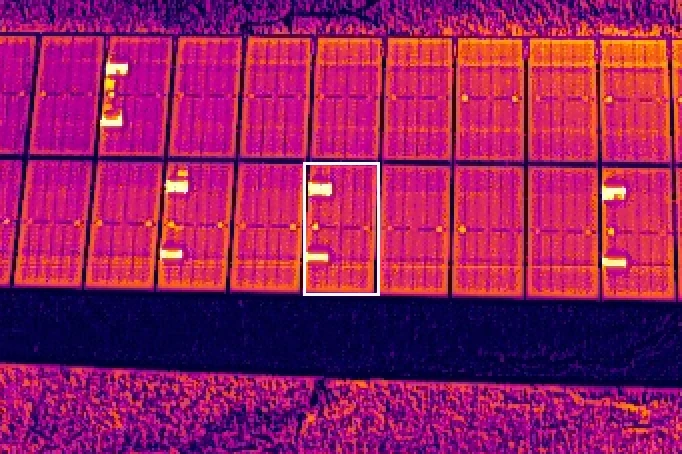
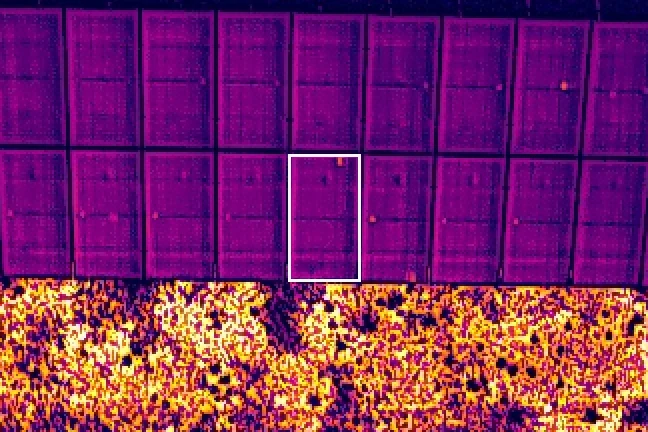
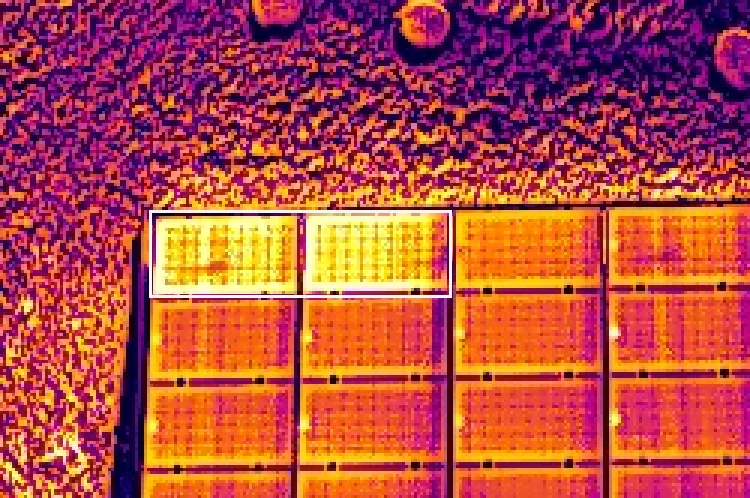
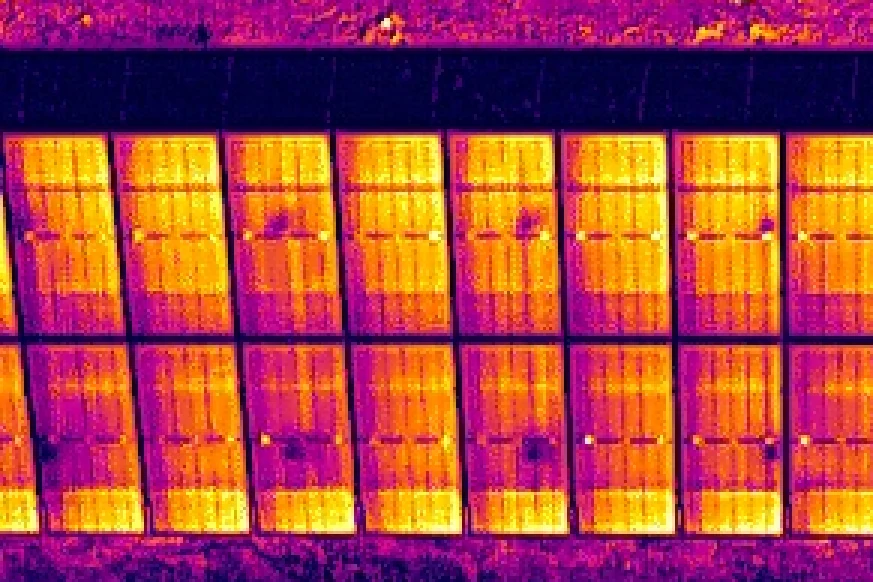
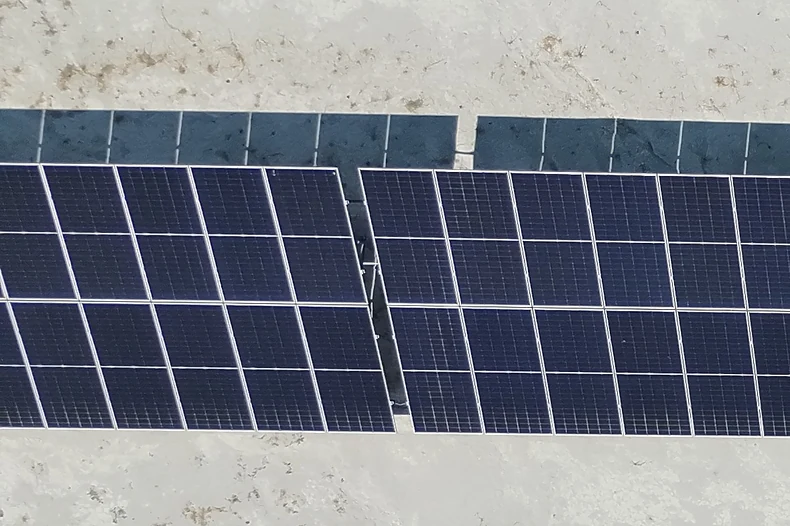
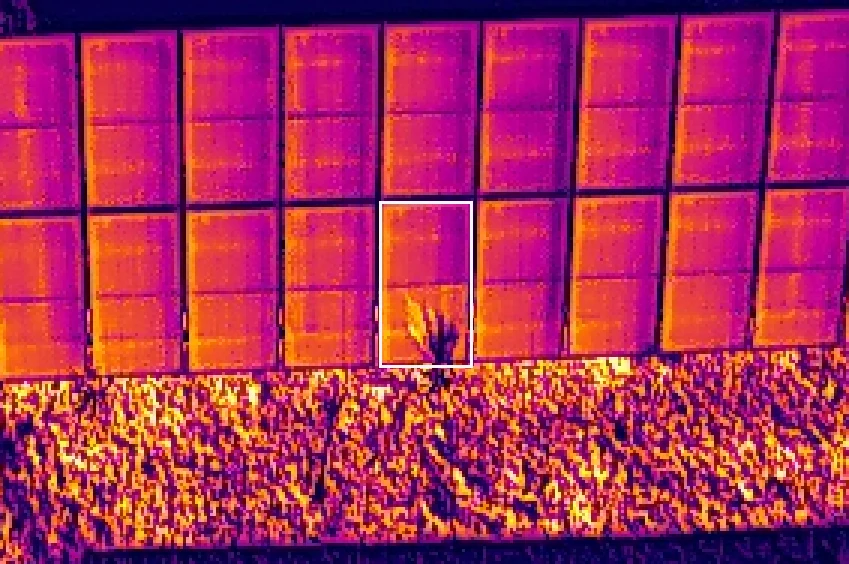
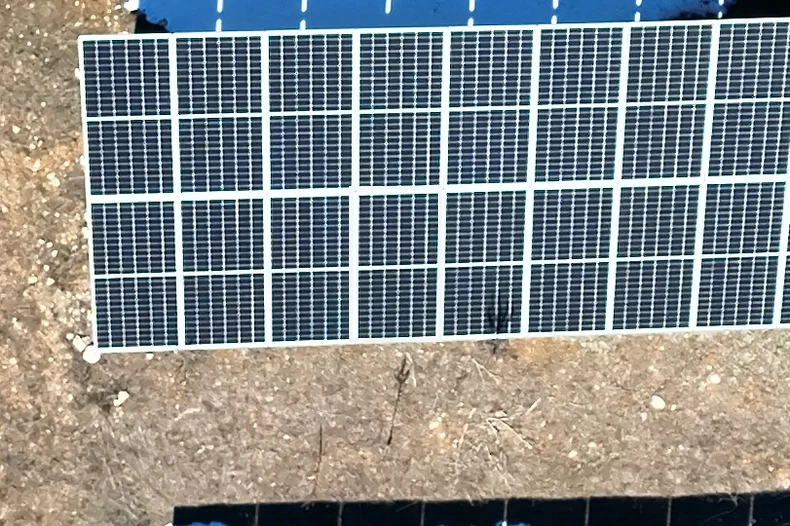
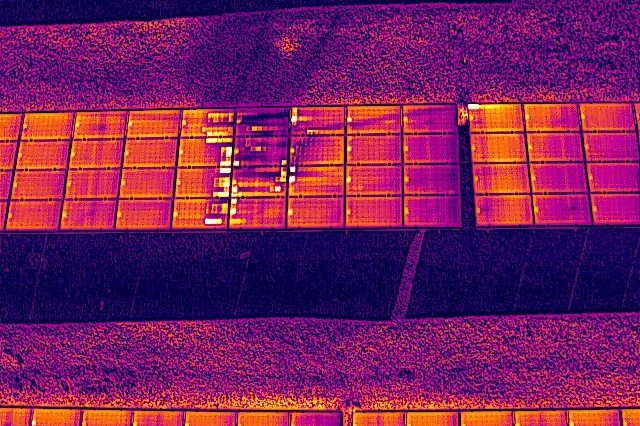
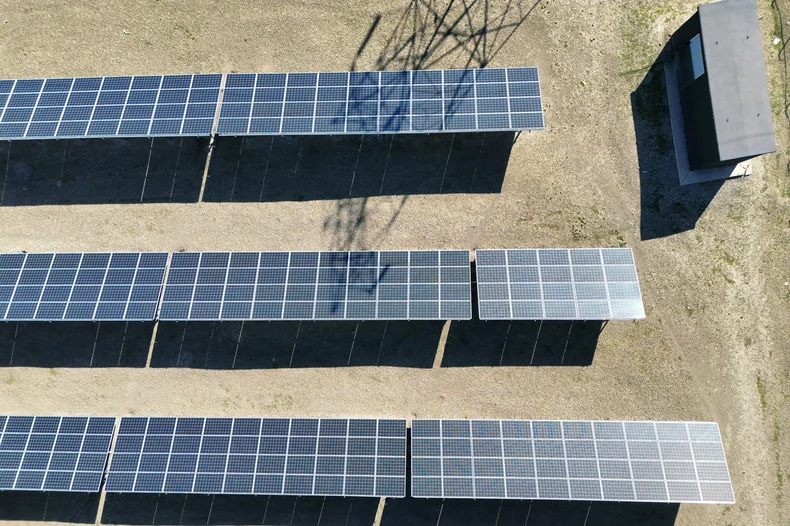
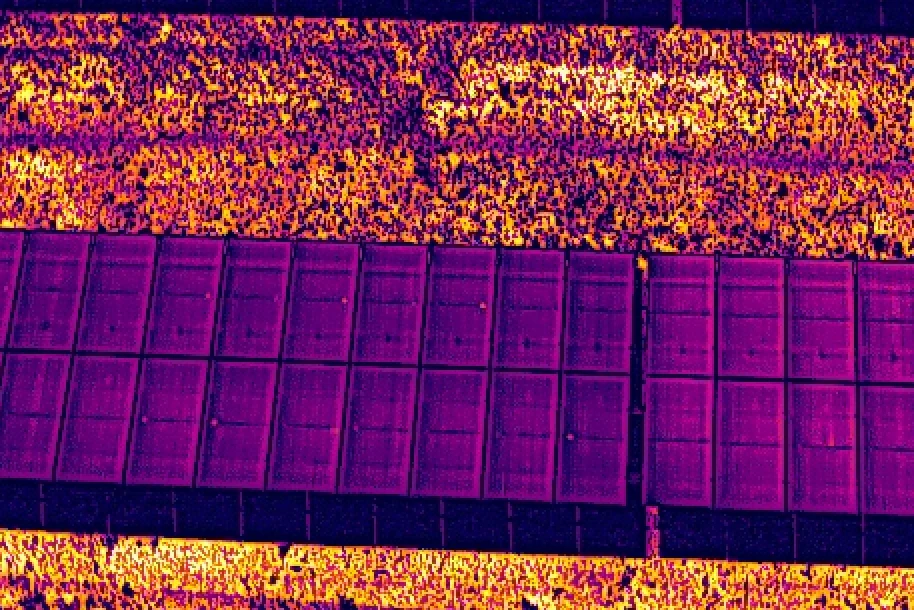
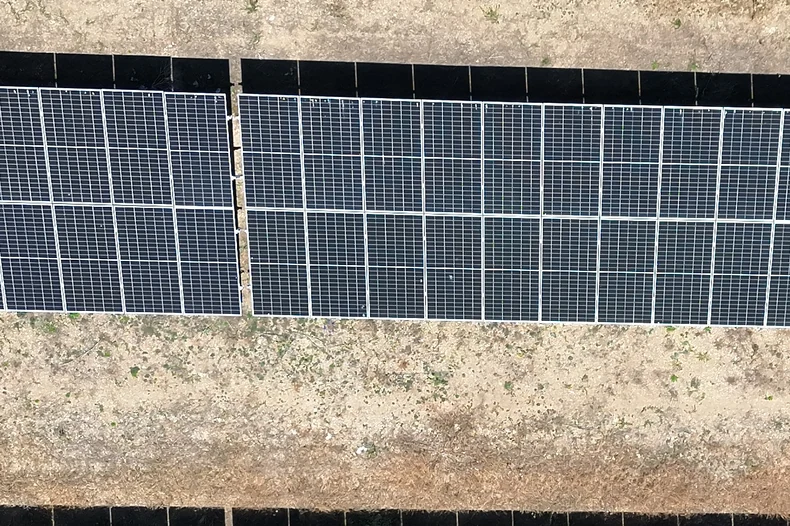
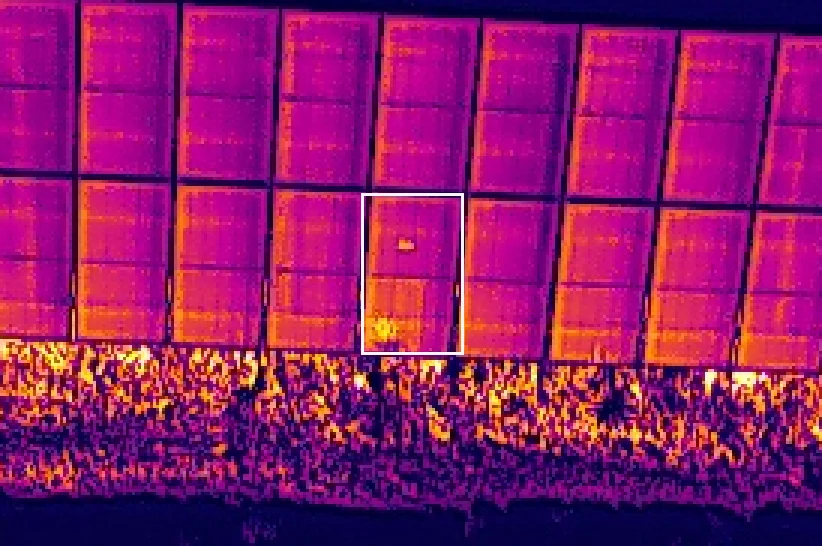
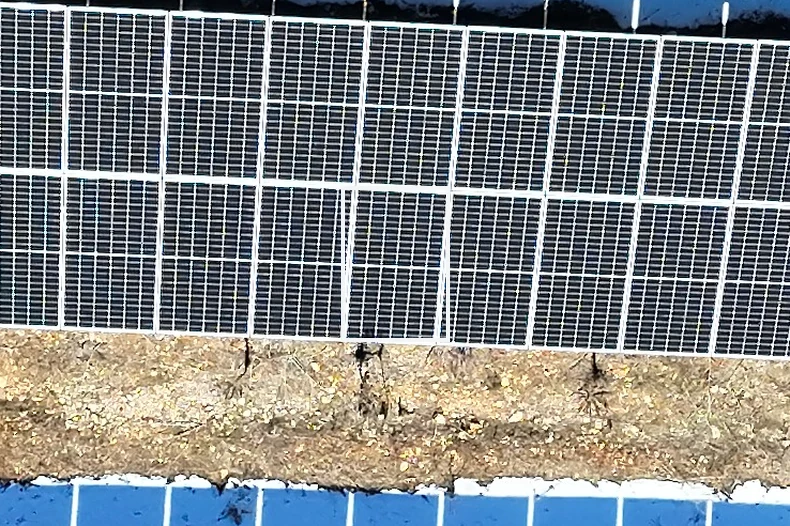
Real images from delivered inspections.
Glass breakageGlass-Breakage
Single diode / substringDiode
Hot spotHot-Spot
String fault (3 or more consecutive modules)String-Fault
Junction box / terminalJunction-Box
Reversed polarityReversed-Polarity
Physical damagePhysical-Destruction
Missing / detached moduleMissing-Module
Multiple diodesDiode-Multi
Multiple hot cellsCell-Multi
Single hot cellCell
Offline moduleOffline-Module
SoilingSoiling
Vegetation shadingVegetation
Structural shadingShadowing
Bird droppingsBird-Droppings
Biological growthBiological-Growth
The methods side by side
SCADA watches the plant's production total and cannot be replaced on the inverter side. A panel-level flight measures every panel, one by one.
| SCADA / inverter monitoring | Panel-level flight | |
|---|---|---|
| Coverage | Inverter or string totals | The whole site, every panel, in one flight |
| Measurement | Total AC output | Every panel from dozens of angles, on an AI-assisted pipeline |
| Address | No address | Which row, which table, which panel |
| Anomaly type | Not determined | One of 17 anomaly classes, with its priority |
| Production loss | Seen in the plant total | An estimated annual loss for every finding |
| Early detection | Panel-level loss can stay hidden inside the totals for years | The anomaly shows while it is small |
| Tracking over time | Production is tracked, panels are not | Every panel's record from inspection to inspection |
Every finding in the report has a known basis
The same three rules apply on every inspection. A number without a source is not published, and a finding based on a single frame does not enter the report.
Flight
We can fly, or you can
If you have an RTK-equipped drone with a thermal camera, your own team can fly. In both cases the data is collected to the same standard and passes the same acceptance check before processing. Data that misses the standard is not processed.
Standard · IEC TS 62446-3
Flown, measured and reported to IEC TS 62446-3.
Compliance is not a certificate. On every flight the measurement conditions are documented.
The three questions asked most in site conversations
- I already see my SCADA data.
You are right. Inverter faults and grid outages are SCADA's job.
Panel loss mostly does not show in SCADA. In summer the inverter clips at its AC limit, and a DC-side loss does not reach the output. In winter the loss stays under weather variability. Even when it shows, SCADA does not say which panel it is in. We say that, and we compare the findings with your SCADA and PR data.
- Our O&M team already flies a drone.
Using a drone is the right call. The difference is not the drone, it is what happens after the flight.
A manual survey photographs the site and an operator reviews the frames by eye, usually deciding from a single frame, and no panel is given a lasting identity. For us the flight is the first step. The frames merge into one orthomosaic, AI finds every module, the temperature difference is normalised to irradiance to IEC TS 62446-3, and every finding is verified across several images. Then every panel is written to the platform under a permanent identity, so you open your plant on a map, click any panel and read its measurement, its class and its history. At the next inspection the same panel is compared under the same identity.
- How is the price calculated?
The price has two lines.
The analysis fee is 200 USD + VAT per 2,500 panels. That is 0.08 USD per panel, with a minimum of 200 USD. The report and platform access are included. If we fly, a capture fee of 200-700 USD per day is added, set by the site. It covers the cost of the flight and is fixed in the quote. If you fly your own RTK and thermal-equipped drone, you pay the analysis fee only. For comparison, by the industry average a plant loses 5.77% of its annual production.
Price and the arithmetic
The analysis fee is calculated by panel count. The capture fee is added only when we fly.
5.77%
Industry-average annual production loss
industry average
200USD + VAT / 2,500 panels
Analysis fee. Report and platform access included.
0.08 USD per panel · ≈ 9,686 TL + VAT · TCMB buying rate of 11 September 2026
Every panel measured, every anomaly verified.
Your plant's panel count and province are enough. We reply within 24 hours with a rate-stamped quote. We fly the mission, or, if you have an RTK and thermal-equipped drone of your own, you fly and pay the analysis fee only. The report and the platform record are delivered within 5 business days of the data entering the system.
Request a quote
Or write directly: info@solardetech.com · +90 536 558 30 23