SolarDetech platform
Panel-level solar asset management platform
The platform records every panel in your plant under a permanent identity, and the record is updated after every flight. Plant management, from the portfolio view down to individual panels and from findings to work orders, is carried out on this record.
The platform is free. The inspection is priced by quote for your site. Log in to the platform
Platform modules
What you manage on the platform
Every step of the maintenance process, from detection to resolution, is managed on one platform. The SolarDetech platform gives every panel in your solar power plant a persistent identity and updates the panel record with every flight. All of the modules below work on that same record.
Portfolio management
The fleet map, last inspection dates, open findings and priority breakdown of all your plants are shown on one screen.
Panel-level digital twin
Each panel's persistent identity, geographic position (block, row, table), electrical position (transformer, inverter, combiner, string) and measurement history are kept. The record is updated with every flight.
Autonomous thermal inspection
The inspection provides 100% panel coverage. Every panel in the plant is imaged, measured with a thermal camera and recorded under its persistent identity. Orthomosaic, panel segmentation and anomaly detection run without human intervention. The model assigns each anomaly to one of 17 classes, and an expert confirms the class.
Work and maintenance management
Every anomaly is listed with its probable root cause. A work order opened from a finding is assigned, tracked and closed. The field team is guided on the map to the relevant panel. The panel's status is tracked from anomaly to repair, and a resolved anomaly is closed on the same record at the next inspection.
Serial number records
Each panel's serial number is entered into its record by scanning the label with a camera (OCR) and can be corrected manually if needed. For warranty claims and panel replacements, the serial number is available together with the panel's position and measurement history.
Inventory management
Panels, inverters and combiner boxes are kept in one inventory with their serial numbers and positions. Spare parts and stock levels are tracked. The history of replaced parts is kept on the record.
Warranty claims
The serial number, measurement history and raw frames are gathered into one claim file. The verification process with the manufacturer is managed on the platform.
Production loss and efficiency
The estimated production loss of every anomaly is calculated. Plant efficiency is tracked by period and by anomaly group.
Performance and trends
The yield and findings of the plants in a portfolio are monitored comparatively. The degradation trend and the estimated loss for the coming period are calculated from the panel history.
Fire risk
Junction box heating, string faults with arc traces and advanced hot spots can carry fire risk. These anomalies go to the top of the list with very high priority.
History and comparison
Measurements of the same panel from different inspections are displayed side by side. This allows comparison after a storm, before and after a warranty claim, and between consecutive flights.
Measurement conditions
The irradiance and weather of every flight are recorded and documented in the report.
Teams and roles
Teams are defined per plant, with separate roles for the field team, the operator and the investor.
Integration
An API is available for partners. You can add your own users to plant teams and create one-click sign-in links for them.
Who it is for
The same panel record for every stakeholder
The platform is used by investors, EPC contractors, O&M teams and panel manufacturers through the same panel-level digital twin. Each user group finds the information relevant to its own responsibilities in that record.
Investor and plant owner
- You can monitor the last inspection date, open findings and priority breakdown of every plant in your portfolio on one screen.
- You can audit the work of your EPC and O&M providers with independent, panel-level measurements.
- You can identify anomalies that cause production loss or may carry fire risk at an early stage. Anomalies that grow between consecutive inspections are highlighted.
- You can support warranty claims with the serial number, measurement history and raw frames.
EPC contractor
- Every panel is measured before commissioning (acceptance) and at the end of the warranty period.
- Installation and workmanship anomalies, such as physical damage, reversed polarity, junction box heating and missing panels, are documented with the panel address.
- Panel serial numbers are entered into the record and kept on the same panel record after handover.
- Acceptance and end-of-warranty measurements are displayed side by side on the same panel identity.
O&M provider
- Findings are presented as a work list sorted by priority and estimated loss. The probable root cause is stated for every anomaly.
- A work order opened from a finding is assigned to a team member and tracked until close-out.
- The field team is guided on the map to the relevant panel by block, row, table and panel.
- The repair is closed on the same panel record at the next inspection, and the panel's history is kept on the record.
Panel manufacturer
- Anomaly types that recur under real operating conditions in the field can be monitored.
- Warranty claims are submitted with the panel's serial number, position, dated measurements and raw frames.
- The claim verification process is managed on the platform.
Portfolio management
The portfolio screen shows all your plants together. It includes the fleet map and, for each plant, the last inspection date, open findings and priority breakdown.
From the portfolio view you can move to plant details and then to panel level. The number of open findings per plant and the plants with very high priority findings are shown on the same screen.
Panel-level digital twin
Every panel in your plant is assigned a persistent identity. Because this identity does not change on later flights, all of a panel's measurements, findings and work orders are kept in a single record. The panel-level digital twin is updated after every flight.
Findings are shown on the plant map. From the map you can open the relevant panel, and from the panel its raw radiometric frame. Thermal and RGB layers are displayed on the same map.
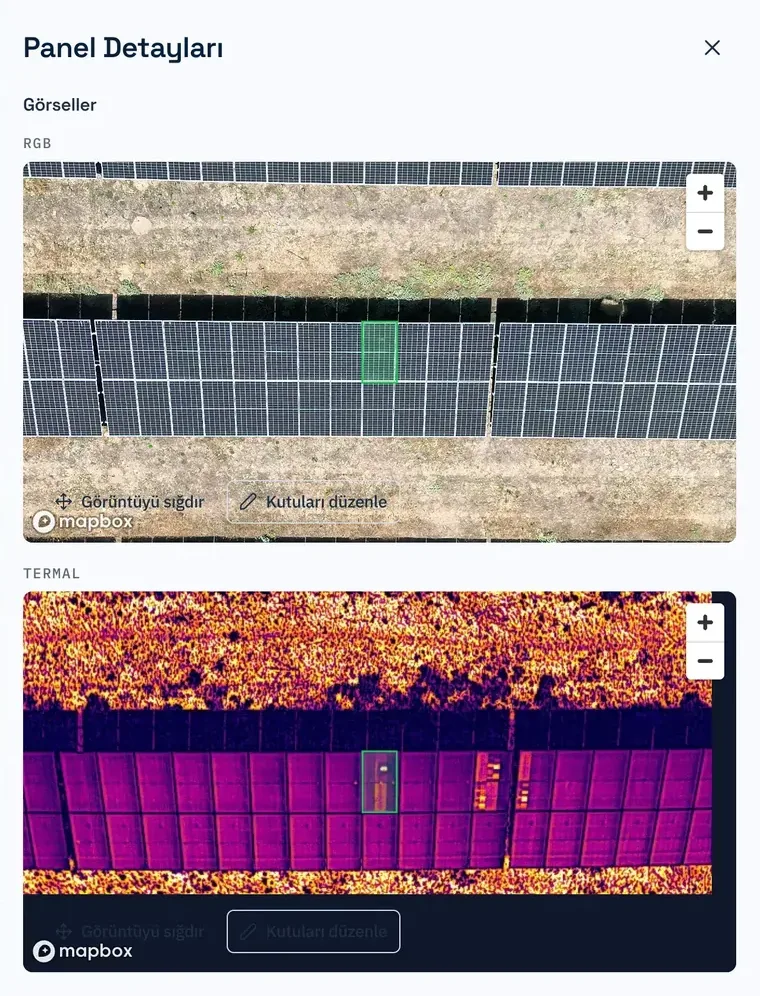
Two addresses for every panel
Geographic position
- Block
- Row
- Table
- Panel
The panel's physical position on site. The tier and column within the table are also recorded. The field team uses this address to locate the panel a finding belongs to.
Electrical position
- Transformer
- Inverter
- Combiner
- String
- Panel
The electrical circuit the panel is connected to. This address identifies which string and inverter a finding affects.
Serial number records
Every panel's serial number is entered into the panel's record. The serial number is kept on the same record as the panel's persistent identity, its geographic and electrical position and its measurement history.
The serial number is recorded by scanning the panel label with a camera (OCR) and can be corrected by hand if needed. Once entered, it remains on the same panel's record at later inspections.
Warranty claim
The information a claim requires, such as the panel's serial number, its position on site, its dated measurements and its findings, is available on one record.
Panel replacement
The serial number of the new panel is recorded at the same position. The replaced panel's serial number and history are retained on the record.
Inventory management
The plant's equipment is kept in one inventory. Panels, inverters and combiner boxes are recorded with their serial numbers and positions. The inventory is kept on the same record as the panel-level digital twin.
Serial numbers are entered by scanning the label with a camera (OCR), and can be corrected by hand. When an item is replaced, the new item is recorded at the same position.
Equipment
Panels, inverters and combiner boxes are recorded with their serial numbers and positions.
Spare parts and stock
Spare parts and stock levels are tracked together with the inventory.
Replacement history
The replaced item's serial number and history are retained on the record.
Warranty claims
The evidence required for a warranty claim is already held on the panel's record. The platform gathers the panel's serial number, its position on site, its dated measurements, its findings and its raw radiometric frames into one claim file.
Verification of the claim with the manufacturer is also carried out on the platform. The claim and its verification steps are tracked against the relevant panel record.
Claim file
Serial number, position, measurement history and raw frames are provided in a single file. Because the information is taken directly from the panel record, it does not need to be compiled separately.
Verification with the manufacturer
The claim is verified with the manufacturer through the platform. The verification process is tracked on the panel record the claim is linked to.
Work and maintenance management
Work orders for the field team are opened from findings on the platform. Each work order is closed on the record of the panel the finding belongs to.
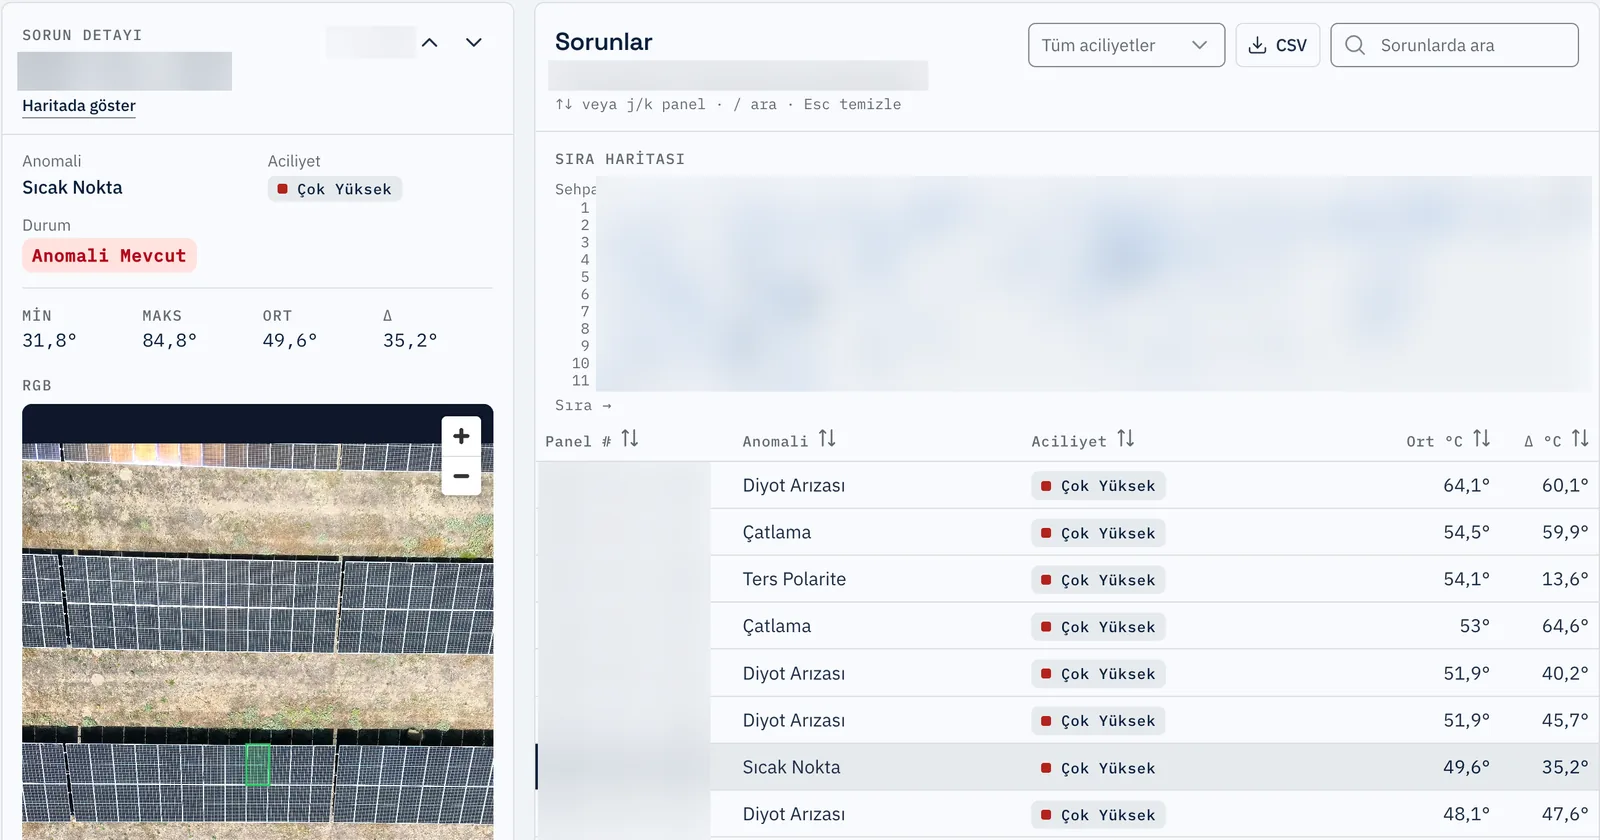
A work order opened from a finding
When a work order is opened from a finding in the list, the finding's class, priority and panel address are transferred to it. The work order is assigned to a role, its status is updated step by step and notes are kept on the work order.
Work order
Opened from a finding
- Anomaly type
- Hot spot
- Priority
- Very high
- Location
- Row 12 · Table 4 · Panel 18
- Assigned to
- Field team
Status
- Opened
- Assigned
- In repair
- Closed
- Note
- Check the panel surface and the junction box. If the panel is replaced, enter the new serial number on the same position.
The close-out is verified on the same panel record at the next inspection.
Finding
Findings are listed with their class, priority, probable root cause, location and estimated production loss, and sorted by priority and loss.
Work order
A work order is opened from the finding and linked to the panel's record.
Assignment
The work order is assigned to a person on the plant team. The field team is directed to the relevant panel via the map.
Status
The job's status is tracked from opening to close-out. Notes stay on the same work order.
Close-out
The repair is recorded. A resolved anomaly is closed on the same panel record at the next inspection.
Panel state
- HealthyThe last inspection found no anomaly on the panel.
- Anomaly presentThe last inspection found at least one anomaly on the panel.
- In repairA repair on the panel is under way.
- Out of serviceThe panel is temporarily out of service.
- DecommissionedThe panel was replaced or removed from the site. Its history stays on the record.
Production loss and efficiency
Annual production loss is estimated for every finding. The share of module power affected by the anomaly class is multiplied by the panel's power and the site's annual yield. The resulting energy value is multiplied by the tariff to give its monetary equivalent.
The temperature difference (ΔT) is used to set the finding's priority and does not increase the loss estimate. The estimate is modelled at the irradiance conditions of the inspection and shows the loss expected over the next twelve months if the anomaly is not corrected. No claim is made regarding production already lost.
Plant efficiency is tracked by period and by anomaly group. Each anomaly group's share of the total loss can be compared across inspections.
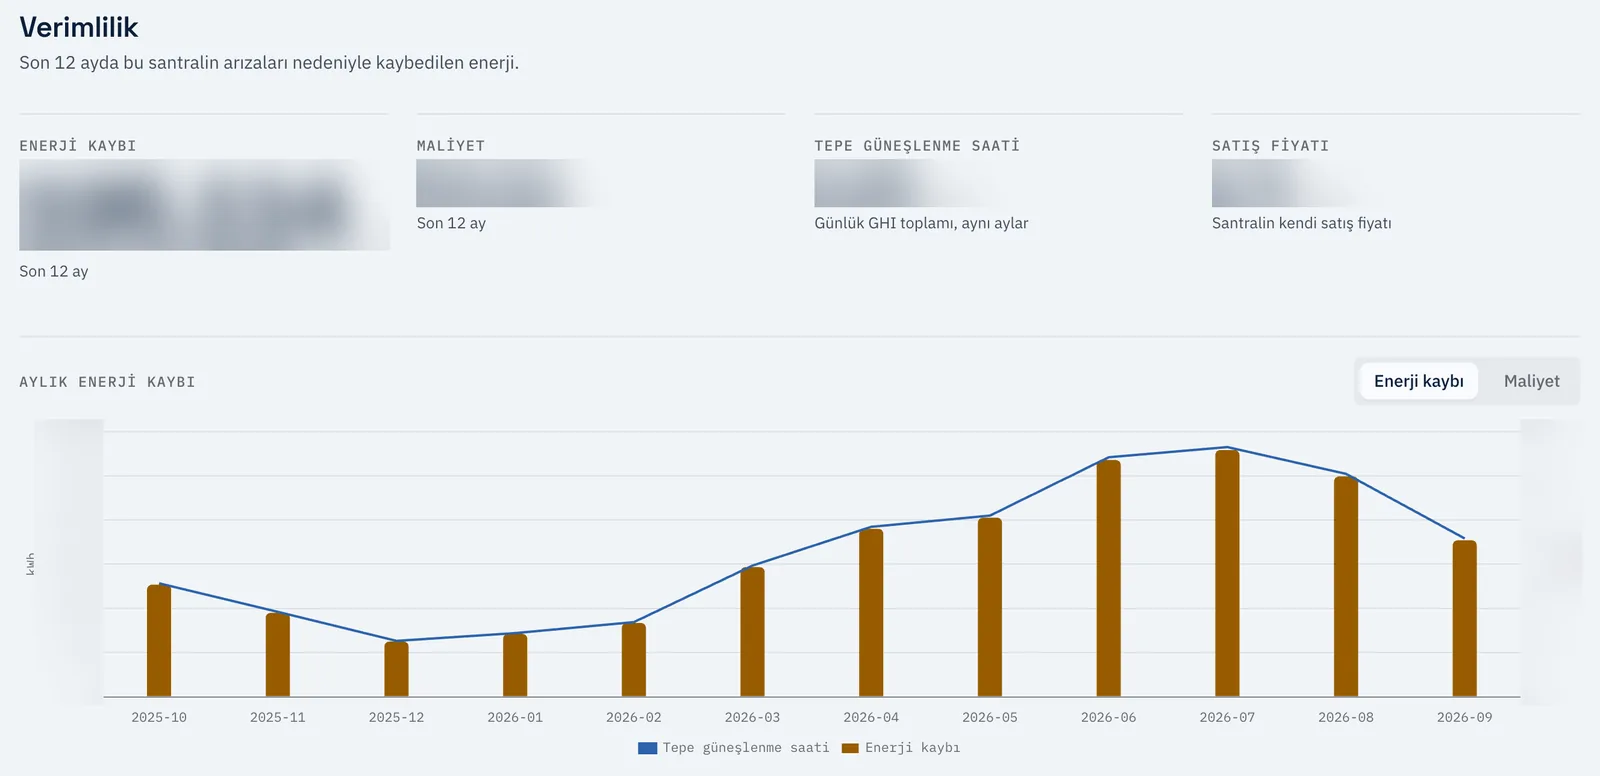
Performance and trends
The performance and trends module is used to follow how your plant develops over time. Because the data from every flight is recorded against the same panel identities, the measurements form a data series over time.
- Plant-to-plant benchmarking
- The yield, anomaly density and priority mix of the plants in a portfolio are compared side by side against the same threshold. This identifies underperforming plants and the reasons behind them.
- Degradation trend
- The rate of degradation at panel and plant level is derived from the panel history. Panels and strings degrading faster than expected are flagged separately.
- Loss forecast
- The production that will be lost in the coming period if current anomalies are left uncorrected is estimated. Maintenance budgets can be prioritised on the basis of this forecast.
Fire risk
Anomalies that may carry fire risk are assessed separately during prioritisation and placed at the top of the list with very high priority. Prioritisation takes safety into account as well as production loss. Because these findings appear first in the report and in the platform list, the field team can be directed to them first.
| Anomaly | Priority |
|---|---|
| Junction box heating | Very high |
| String fault with arc traces | Very high |
| Advanced hot spot | Very high |
History and comparison
Flights from different dates are compared on the same panel identities and at the same threshold. New, growing and resolved anomalies are listed separately. Three typical use cases are described below.

After a storm
The flight after the storm is compared with the previous one. New physical damage and missing or detached modules are listed as new findings with their panel addresses.
Before and after warranty
A flight before the warranty period expires places a dated measurement of every panel on record. After a replacement or repair, the next flight measures the same panel again and the two records can be compared side by side.
Flight-to-flight time series
The data from every flight is added to the same panel record. A panel's temperature history is tracked across inspections, and growing anomalies become clearly visible.
Teams and roles
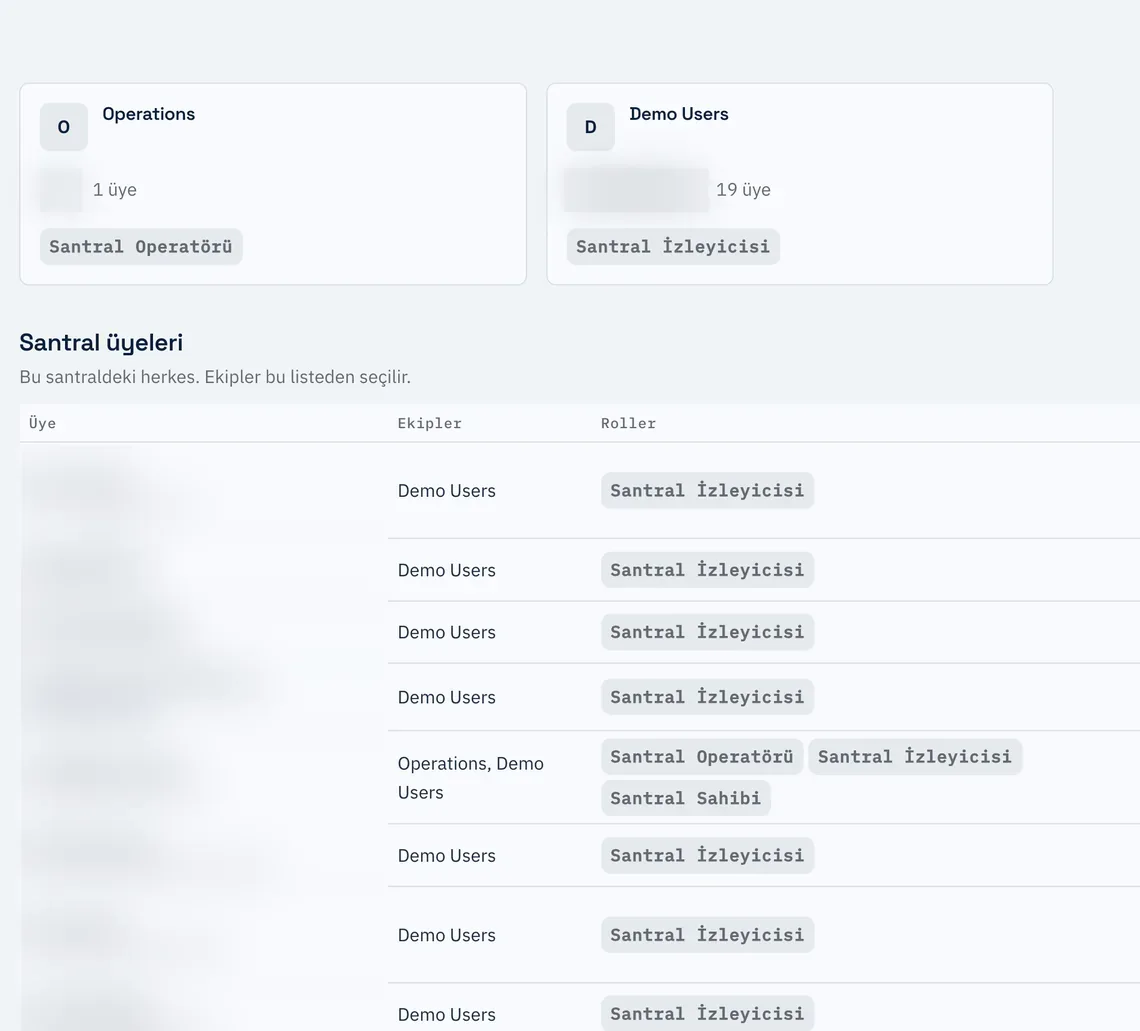
Every plant has its own team. The field team, the operator and the investor reach the same panel record with separate roles.
Users are added to teams and each user is assigned a role per plant. A user can be a member of several plants' teams.
Integration
An API is available for partners. With it you can add users from your own system to plant teams and generate one-click sign-in links for them.
Your users can then go directly from your own application to the plant's record on the platform. This API is for user and access management. A separate data API is available for transferring finding and panel data to your own systems. SCADA and inverter data can also be connected to the platform as an option.
Measurement conditions
The irradiance and weather of every flight are recorded and documented in the report.
Measurement takes place on a clear day at no less than 600 W/m² irradiance. Because the conditions are stated in every report, flights from different dates can be compared on the same basis.
The platform checks the irradiance, wind and cloud cover of the flight hours against the IEC TS 62446-3 thresholds. A condition outside its threshold is flagged openly.
More capabilities
The capabilities below work on the same panel record. Solution partner services are optional.
Planning and field
Periodic inspection planning
An inspection calendar is kept for each plant, and reminders are sent before upcoming inspections.
Flight plan generation
The flight route is generated automatically from the plant boundary.
Mobile use for field teams
The field team can open work orders on a phone, add photos and locate the panel on the map.
Notifications and alerts
The relevant people are notified when a high-priority finding is detected or the status of a work order changes.
Maintenance
Spare parts and stock tracking
Spare parts and stock levels are tracked together with the inventory.
Cleaning planning
Cleaning priority and schedule are set based on the soiling findings.
Vegetation and shade management
Work orders are opened for vegetation shading findings.
Integration and reporting
SCADA and inverter data integration
SCADA and inverter data can optionally be connected to the platform.
Data API
Finding and panel data can be transferred to your own systems through an API.
Export
Findings and the panel record export as CSV, GeoJSON and PDF.
Multilingual reports
The report can be prepared in other languages. The report language is set at the quotation stage.
Insurance report
After a storm, hail or fire, the affected panels are gathered into a dated, located damage file with their before and after measurements and raw frames.
Finance and investor report
A technical condition summary covering the plant's overall health, priority breakdown and estimated production loss is prepared for a bank, buyer or investor.
Inspection types
Commissioning and acceptance inspection
For EPC handover and the start of the warranty, the first measurement of every panel is recorded.
Pre-warranty-expiry inspection
Before the warranty expires, a dated measurement of every panel is recorded.
Rapid damage inspection after storms and hail
New physical damage is identified by panel address through comparison with the previous flight.
Solution partner services (optional)
I-V curve and insulation measurement
Carried out optionally by our solution partner.
Maintenance and panel replacement
Carried out optionally by our solution partner.
How the data is processed
All of the modules above work with data from autonomous thermal inspection. Drone data is converted, without human intervention, into an orthomosaic, panel outlines and detected anomalies. The model assigns each anomaly a class, an expert confirms the class, and the result is written into the panel-level digital twin.
Coverage and verification
- 100% of panels are measured with the thermal camera.
- Each panel is seen in a median of 15 separate thermal frames.
- 96.9% of panels are verified in at least 10 separate thermal frames.
Orthomosaic
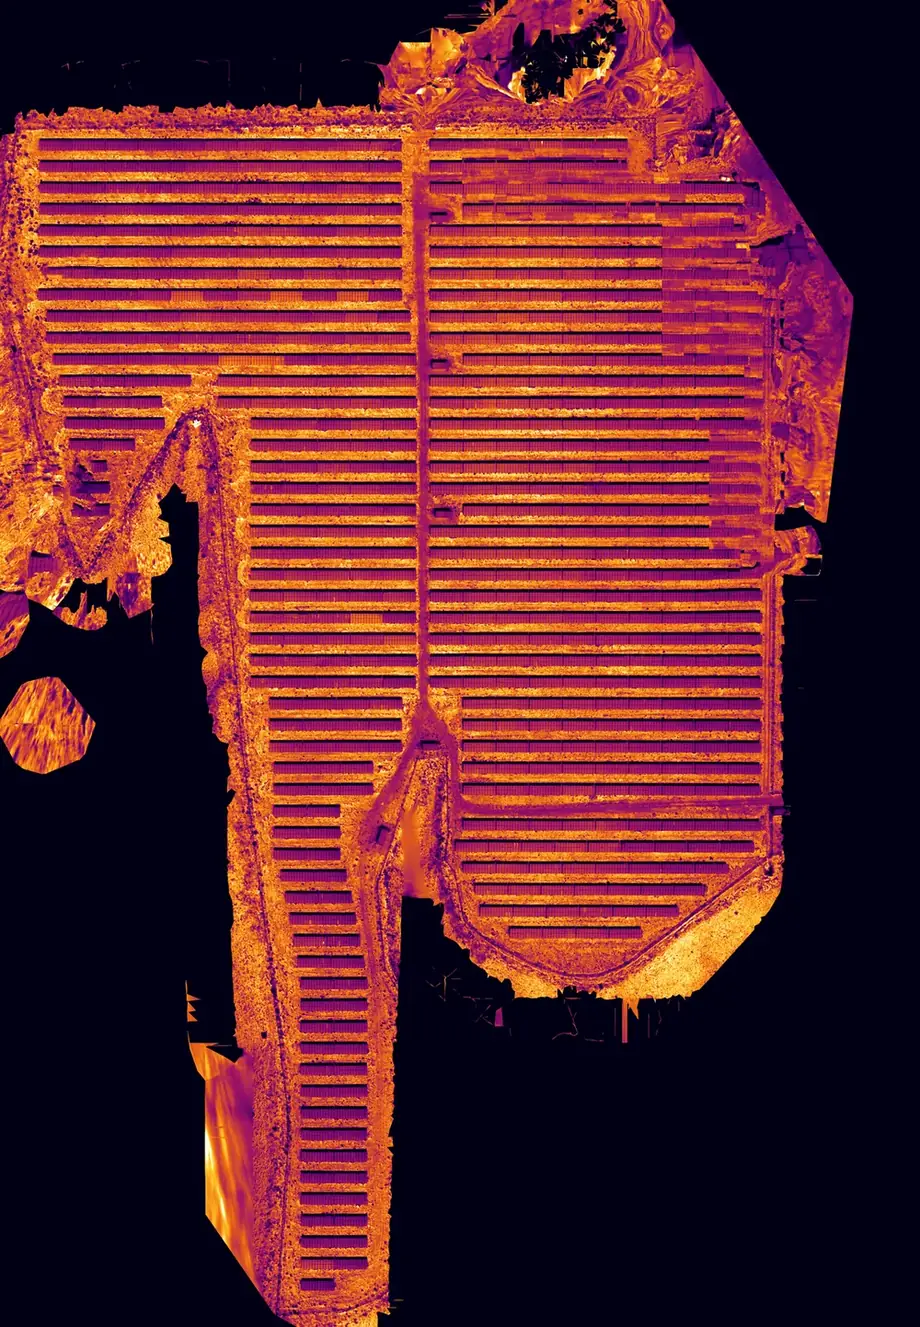
The thermal and RGB frames of the flight are merged into one map. The thermal map is aligned on the same pixel grid as the visible-light map. Temperature differences can be read directly on the map.
The orthomosaic is built without human intervention. Before the processing stage begins, coverage, row continuity, brightness uniformity and edge sharpness are checked automatically.
Segmentation
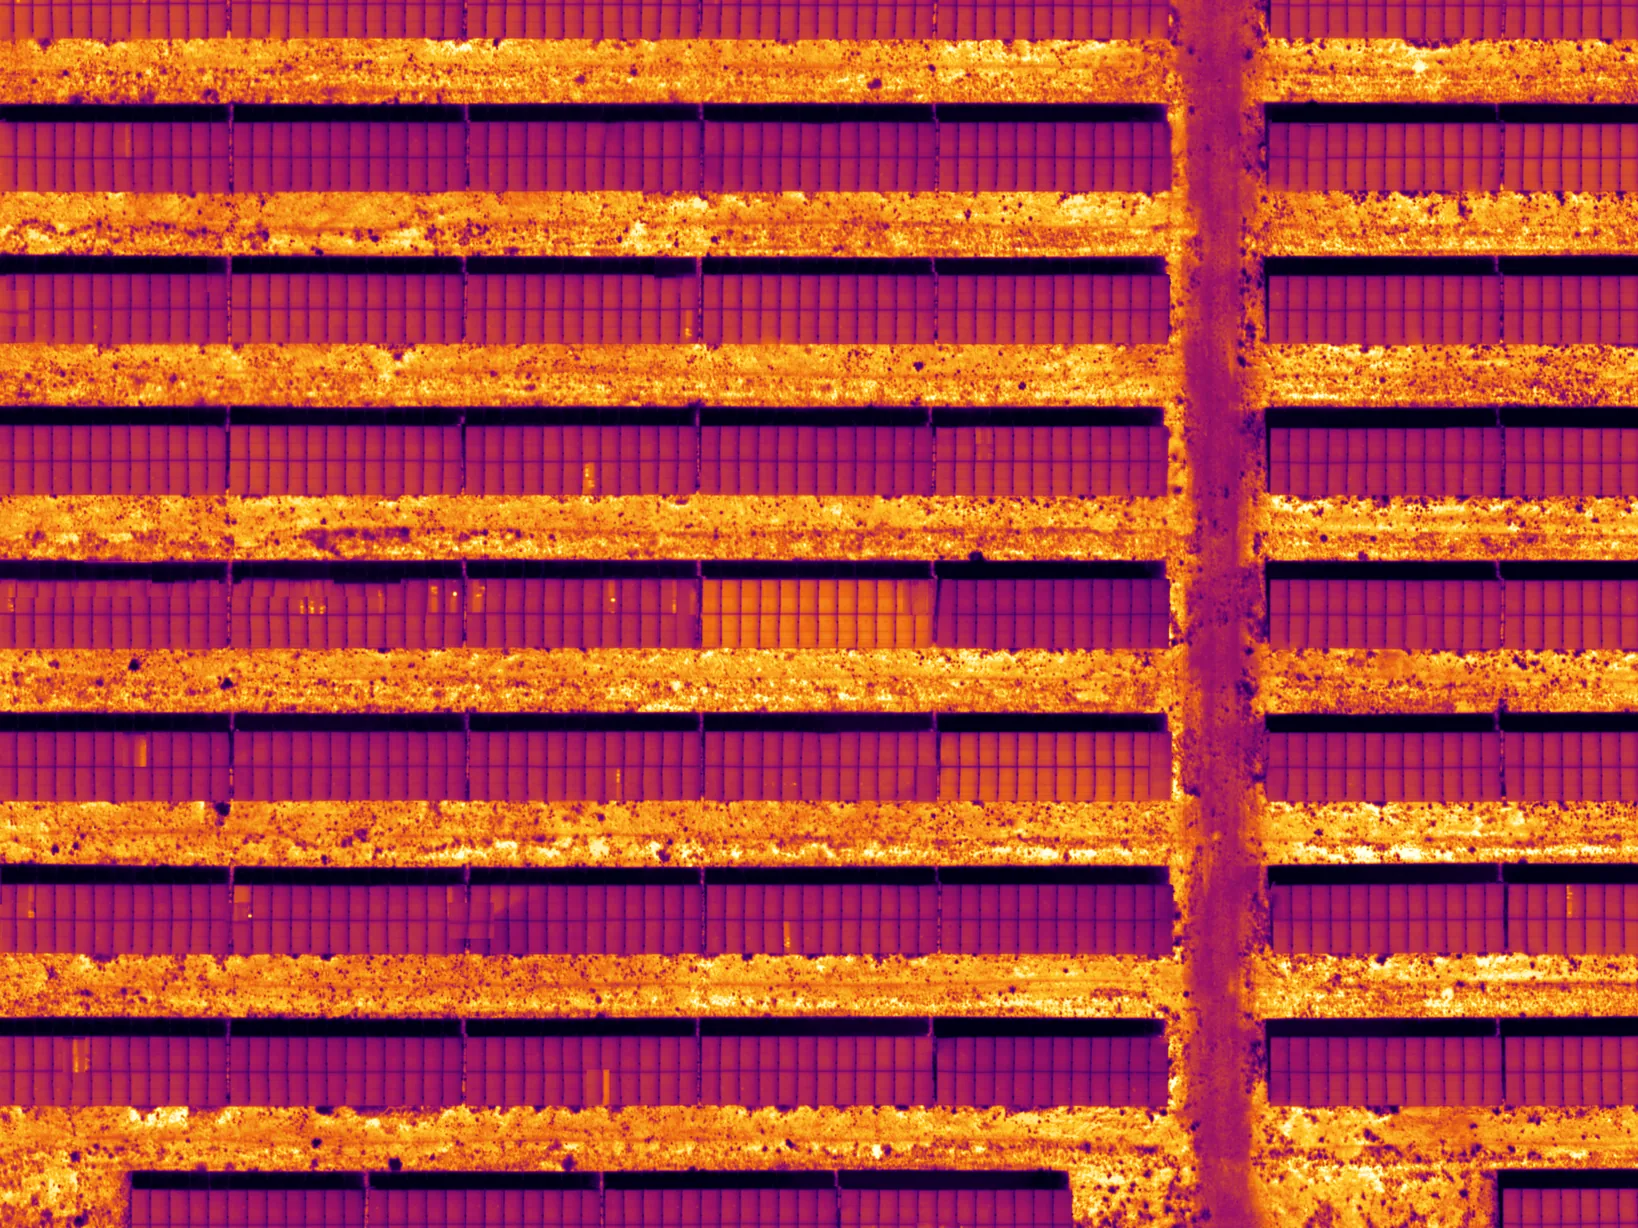
Panel outlines are extracted from the orthomosaic without human intervention. Each module is separated by its own polygon and tied to its persistent panel identity.
Measurement takes place inside these outlines. Each panel's temperature is compared with neighbouring panels and normalised to irradiance. Panels showing a deviation are flagged.
17 anomaly classes
The model assigns every flagged panel one of 17 anomaly classes and one of four priority levels (very high, high, medium, low). An expert confirms the class of every anomaly in the report. Classification follows the IEC TS 62446-3 methodology. Prioritisation takes safety into account as well as production loss.
| Class | Channel | Priority |
|---|---|---|
| Single hot cell | Thermal | Medium → Very high |
| Hot spot | Thermal | Medium → Very high |
| Multiple hot cells | Thermal | Medium → Very high |
| Single diode / substring | Thermal | Medium → High |
| Multiple diodes | Thermal | High |
| Physical damage | RGB + thermal | Very high |
| Offline module | Thermal | High |
| String fault (3 or more consecutive modules) | Thermal | High · very high if arcing |
| Junction box / terminal | Thermal | Very high |
| Reversed polarity | Thermal | Very high |
| Glass breakage | RGB | Very high |
| Missing / detached module | RGB | High · very high if hanging |
| Soiling | RGB | Low |
| Bird droppings | RGB ≤1 cm/px | Low |
| Biological growth | RGB ≤1 cm/px | Low |
| Vegetation shading | RGB + thermal | Low |
| Structural shading | RGB + geometry | Low |
With your own drone
The platform is hardware-agnostic and works with RTK drones carrying a radiometric thermal camera. If you have a suitable drone, your own team can carry out the flight. Capture takes place under the flight conditions we set in line with IEC TS 62446-3. SolarDetech approves every inspection. Approval covers data acceptance and the upload link. Processing after approval is fully autonomous. The data passes through the same checks as our own team's flights.
| Positioning | RTK. The route is not started until RTK FIXED status is reached. |
|---|---|
| Cameras | Radiometric thermal and RGB |
| Flight altitude | 30 metres |
| Resolution | At least 5×5 pixels per cell at 30 m |
| Conditions | A clear day, at least 600 W/m² irradiance |
Steps
- RequestProvide details of your plant and your drone in the form.
- ApprovalSolarDetech approves every inspection. Approval covers data acceptance and the upload link. Processing after approval is fully autonomous.
- Upload linkAn upload link is sent to you after approval.
- Data uploadYou upload the flight's thermal and RGB frames through the link.
- ReportThe report and the platform record are delivered within 5 business days of the data entering the system.
Our field team operates throughout Turkey. Data from plants outside Turkey is also accepted.
Bring your plant onto the platform
You can carry out the flight with your own drone or leave it to our field team. We send our quote within 24 hours at most.
The seven steps from flight to report are shown in order on the solar thermal inspection platform page.