Sample report
Sample inspection report: chapters and the finding page
Every inspection ends with an inspection report prepared following the IEC TS 62446-3 methodology. This page walks through the structure of a delivered report, using its masked pages.
50 pages of a 315-page report
The opening of a delivered report
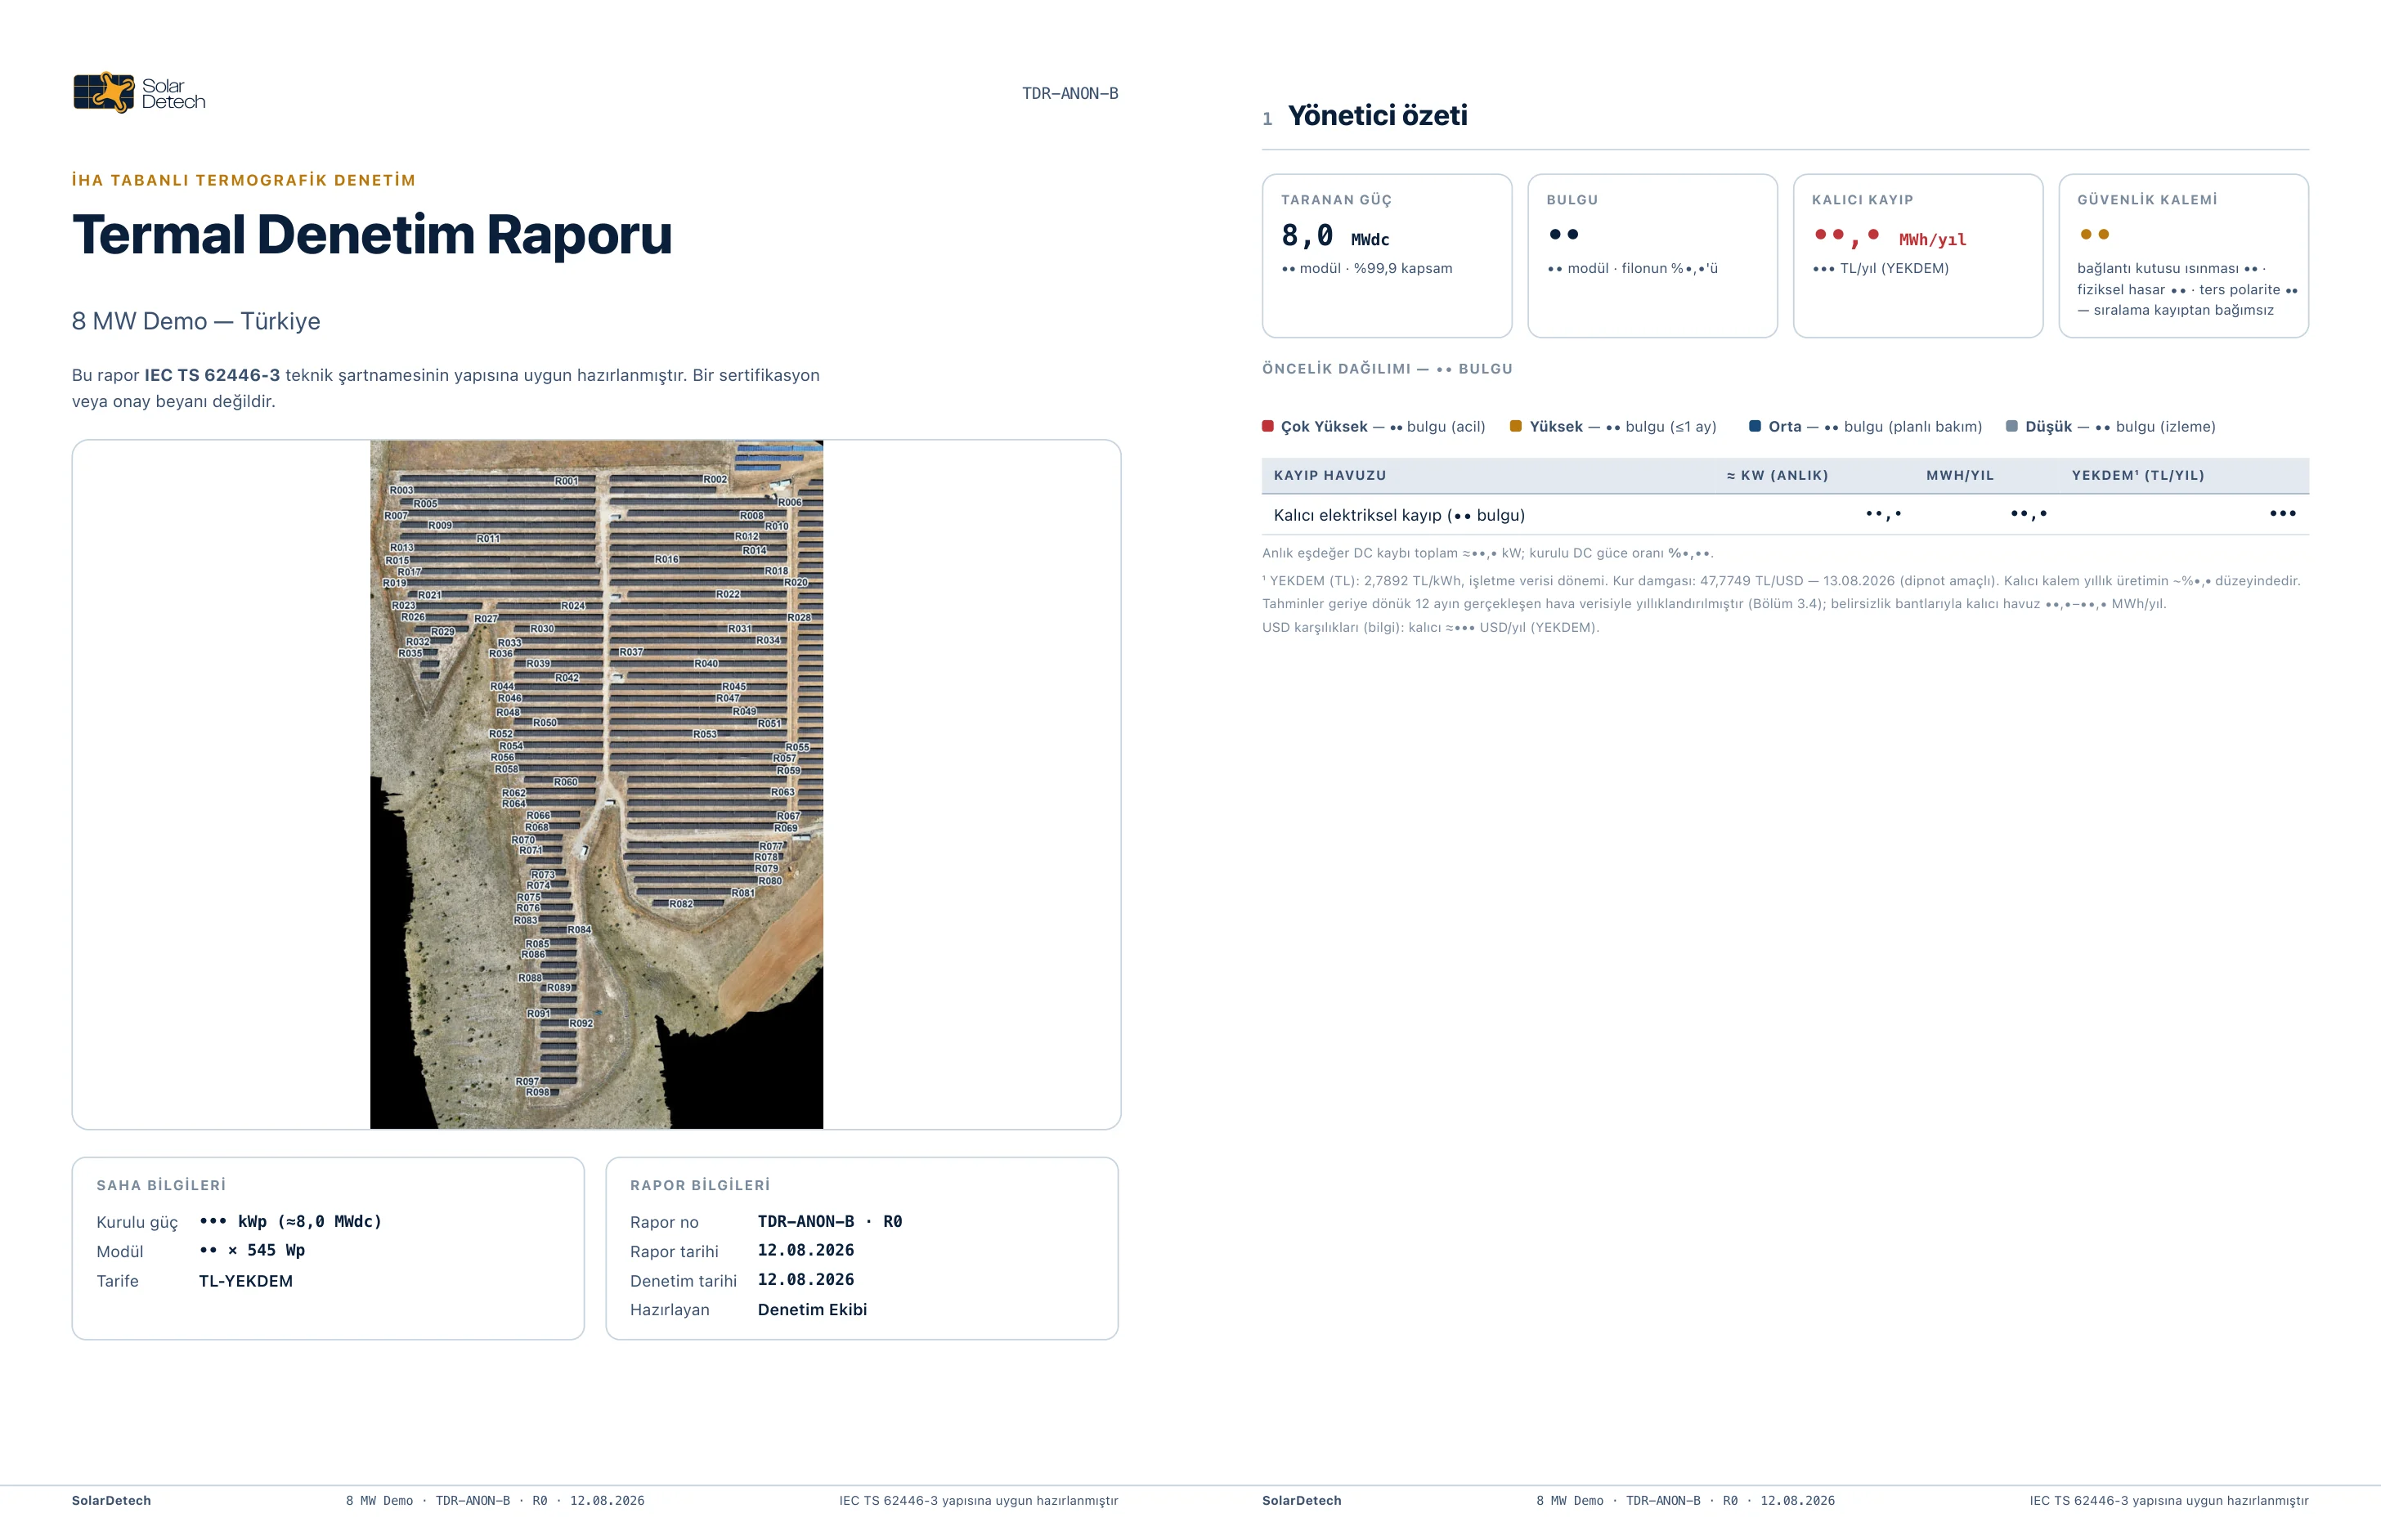
The cover and executive summary pages of the report. The plant shown is the 8 MW demo site; site details and amounts are masked.
The report's chapters
The report begins with a summary prepared for the investor and the operator, followed by the technical chapters and the finding cards.
- CoverThe plant, the report number and the inspection date. The cover states that the report is prepared to the structure of IEC TS 62446-3 and that this is not a certification.
- Executive summaryInspected capacity, number of findings, estimated loss, safety items and the priority breakdown of the findings are presented on one page.
- Inspection conditionsIrradiance, wind, cloud cover and temperature values for the flight days are given together with their IEC TS 62446-3 thresholds.
- MethodExplains how the temperature difference is measured and normalised to irradiance, how classes are assigned and how priority is set.
- Loss and revenue analysisGives the estimated annual energy loss by anomaly class and its monetary equivalent at the tariff.
- Site observationsGeneral observations kept separate from the finding list. No priority or loss value is assigned to them.
- Findings mapsThe locations of the findings in the plant are shown on the RGB and thermal orthomosaics.
- Anomaly indexAll findings are listed in order of priority. The list includes panel location, anomaly class, number of modules affected, temperature difference, peak temperature, priority and estimated annual loss. Each line links to the relevant finding card.
- Finding cardsA separate page is prepared for each finding. One of these pages is explained below as an example.
Fields of a finding page
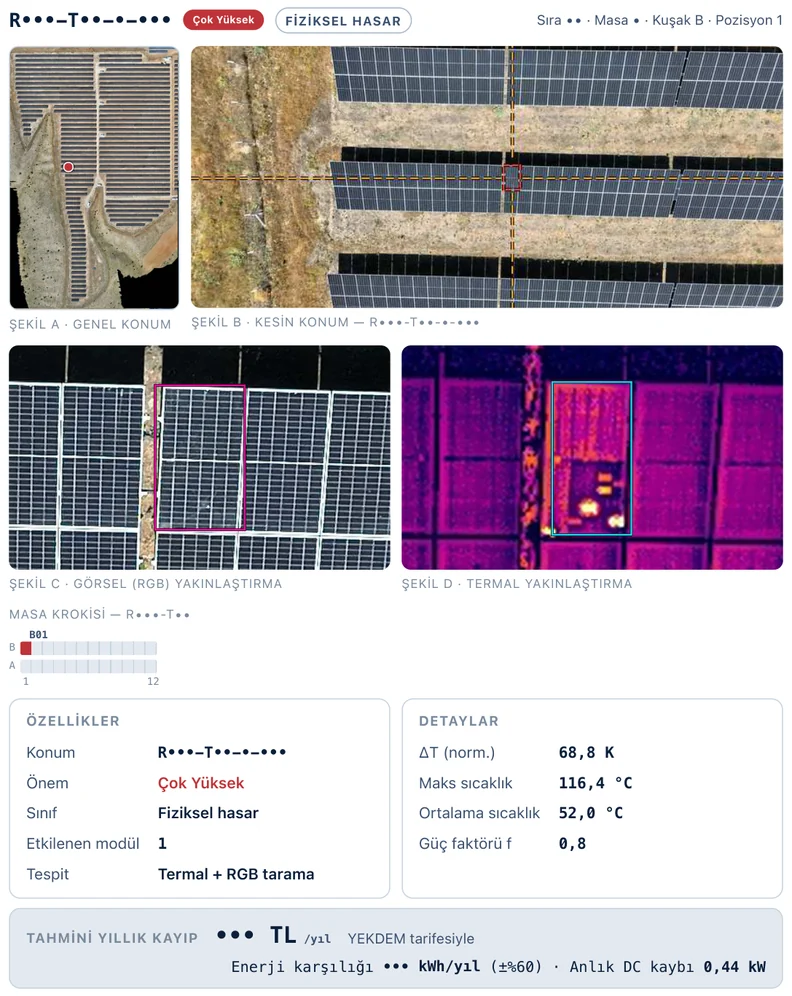
Every finding has its own page in the report. The field team locates the panel using the information on this page, and managers base their decisions on it. The panel identity and the amount are masked in the sample.
- Panel address
- The top of the page shows the panel's identity, priority and class. Next to it is the panel's address on site (row, table and the panel's position in the table).
- General and exact location
- Figure A shows where the panel sits on the plant map. Figure B marks the same panel on the orthomosaic, with the lines of its row and table.
- RGB and thermal close-ups
- Figure C shows the panel in visible light and Figure D in the thermal image, in the same frame. Physical damage is assessed in the RGB image and heating in the thermal image.
- Table sketch
- A schematic of the table the panel is in. The panel with the finding is marked on the sketch, which the field team uses to reach the right panel.
- Properties
- Location, priority, anomaly class, number of modules affected and the type of image the finding was detected in (thermal, RGB or both).
- Measurement
- The temperature difference normalised to irradiance (ΔT), the panel's peak and mean temperature, and the power factor: the share of module power the class takes away.
- Estimated annual loss
- The finding's annual energy loss and its monetary equivalent at the tariff, with an uncertainty range. The instantaneous DC power loss is shown below it.
How the loss is estimated
The share of module power the anomaly class affects is multiplied by the panel's power and the site's annual yield. The resulting energy value is multiplied by the tariff to give its monetary equivalent.
The temperature difference is used to set the priority and does not increase the loss estimate. The estimate shows the loss expected over the next twelve months if the anomaly is not corrected. No claim is made regarding production already lost.
The measurement conditions are documented in the report
The irradiance and weather of every flight are written into the report's own conditions chapter. This allows the conditions under which each thermal value was taken to be traced within the report.
Flights are made on a clear day at no less than 600 W/m² irradiance. Measurements are taken under load from multiple images and normalised to irradiance.
| Flight altitude | 30 metres |
|---|---|
| Cameras | RGB and radiometric thermal |
| Route | Lines crossing the panel rows, the whole site in one flight |
| Positioning | The flight does not start before RTK is fixed |
| Conditions | A clear day, at least 600 W/m² irradiance |
| Resolution | At least 5×5 pixels per cell |
at least 600 W/m²
Flight goes ahead
How to read priority
Each finding is assigned one of four priority levels. Findings are listed in this order in the report and on the platform.
- Very highAnomalies that carry a safety risk or whose temperature difference sits in the highest band. Physical damage, glass breakage, junction box and reversed polarity anomalies start at this priority level. Anomalies that can carry fire risk (junction box heating, string fault with arc traces, advanced hot spot) are always here.
- HighAnomalies that directly cut production, such as diode and string faults and offline modules.
- MediumCell heating and hot spots whose temperature difference stays limited. As the temperature difference increases, the priority can rise up to very high.
- LowConditions to monitor, such as soiling, bird droppings, biological growth and shading.
Priority is set on the basis of safety risk as well as production loss. A burnt junction box and reversed polarity are rated very high even where the loss is small. Classes that cannot be told apart with confidence from the image are flagged with a low confidence value.
| Anomaly class | Channel | Priority |
|---|---|---|
| Single hot cell | Thermal | Medium → Very high |
| Hot spot | Thermal | Medium → Very high |
| Multiple hot cells | Thermal | Medium → Very high |
| Single diode / substring | Thermal | Medium → High |
| Multiple diodes | Thermal | High |
| Physical damage | RGB + thermal | Very high |
| Offline module | Thermal | High |
| String fault (3 or more consecutive modules) | Thermal | High · very high if arcing |
| Junction box / terminal | Thermal | Very high |
| Reversed polarity | Thermal | Very high |
| Glass breakage | RGB | Very high |
| Missing / detached module | RGB | High · very high if hanging |
| Soiling | RGB | Low |
| Bird droppings | RGB ≤1 cm/px | Low |
| Biological growth | RGB ≤1 cm/px | Low |
| Vegetation shading | RGB + thermal | Low |
| Structural shading | RGB + geometry | Low |
The panel record that comes with the report
The report is the output of the panel-level digital twin on the platform for the flight in question. The findings in the report are also available in your plant's panel record on the platform.
Panel-level digital twin
Every panel is recorded on the platform under its own identity. You can view findings on the map, convert them into work orders, assign them to your team, track their status and record their close-out. Every inspection is added to the same panel record, and a resolved anomaly is closed at the next inspection.
Panel-level record
The position, measured temperature difference and deviation from neighbouring panels are recorded for every panel.
Sample report · PDF · 50 pages
Get the full sample report
The masked sample report is sent to your e-mail address as a PDF. All you need to provide is your e-mail address.
Get a quote for your plant
Send us your panel count and plant location. We send our quote within 24 hours at most.