Panel-level solar plant inspection
In a single flight every module in your plant is imaged, measured and classified. The result is a plant-wide verified anomaly list together with a production loss analysis.
Deliverables
What you receive at the end of a flight.
| Orthomosaic mapping | A single stitched map of the whole plant. | The whole site |
|---|---|---|
| Panel-level record | For every panel, its position, the measured temperature difference and its deviation from its neighbours. | Platform |
| Prioritised anomaly list | Findings with their type named and prioritised. Every finding is verified across several images. | 17 anomaly classes |
| Production loss analysis | The estimated annual production loss for every finding. | Per finding |
| Inspection report | A summary section for investor and operator, followed by the technical finding list. | One report per flight |
| Digital record, panel by panel | Every panel is on the platform under its own identity. You locate the finding on the map, turn it into a work order and write the closing note. Every inspection is added to the same panel record. A resolved anomaly closes at the next inspection. | Fleet · map · panel record |
Sample report
50 pages of a delivered inspection's 315-page report. Cover, executive summary, inspection conditions, method, loss and revenue analysis, site observations, findings maps and the complete anomaly index. Then the finding cards: all eleven findings at the highest priority and examples at high, medium and low priority. Every card carries the panel's position, an RGB and a thermal zoom, the table sketch, the measured temperature difference and the annual loss.
Price
The price has two lines. The analysis fee is calculated by panel count. It is 200 USD + VAT per 2,500 panels, that is 0.08 USD per panel, with a minimum of 200 USD. The capture fee is added only when we fly and is calculated by the day. Prices exclude VAT.
01 · Analysis
Analysis fee · list price
200 USD + VAT / 2,500 panels
For every panel, detection and measurement, classified and prioritised findings, loss analysis, the inspection report and platform access.
02 · Flight
Capture fee
200–700 USD / day
Paid only when we fly. If you fly your own drone, you pay the analysis fee alone.
Send your panel count and location. Within 24 hours both lines, with their TL equivalent, are in front of you.
- Industry-average annual loss
- ≈ 2,629,000 TL / year≈ 943 MWh/year · 5.77% of production
- Analysis fee · list price
- 1,440 USD + VAT≈ 69,740 TL + VAT
- Capture fee
- 200-700 USD / dayonly when we fly · VAT excluded
Even a tenth of this loss on your site is 3.8 times the analysis fee.
Assumptions: 1,650 kWh/kWp a year · 2.7892 TL/kWh (August 2026) · industry-average loss 5.77%. Your site's own loss is known only by measuring.
Rate: TCMB buying rate of 11 September 2026 · Prices exclude VAT
| Panel count | Analysis fee (+ VAT) | ≈ TL (+ VAT) |
|---|---|---|
| 1,000 panels | 200 USD | 9,686 TL |
| 2,500 panels | 200 USD | 9,686 TL |
| 10,000 panels | 800 USD | 38,744 TL |
| 25,000 panels | 2,000 USD | 96,861 TL |
| 50,000 panels | 4,000 USD | 193,722 TL |
The fee includes panel detection and measurement, prioritised findings, loss analysis, a report to the IEC TS 62446-3 standard and platform access. A minimum of 200 USD applies. Prices exclude VAT. The TL equivalent is stamped at the day's rate on the quote.
Flight standard
Every site is flown with the same parameters.
| Flight altitude | 30 metres |
|---|---|
| Cameras | RGB and radiometric thermal |
| Route | Lines crossing the panel rows, the whole site in one flight |
| Positioning | The flight does not start before RTK is fixed |
| Conditions | A clear day, at least 600 W/m² irradiance |
| Resolution | At least 5×5 pixels per cell |
We fly the mission, or your own team flies it with an RTK-equipped drone carrying a thermal camera. Either way the data goes through the same checks. Data that does not meet the IEC TS 62446-3 standard is not processed.
All classes
The classification follows the IEC TS 62446-3 standard. The cut images are from a real inspection.
Single hot cellCell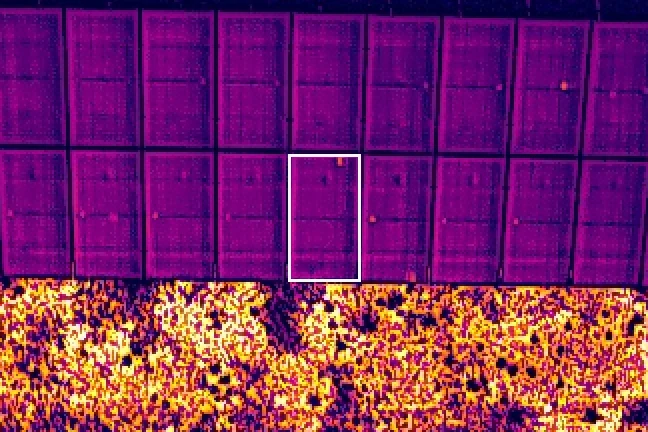 | Thermal | P3 → P1 |
|---|---|---|
Hot spotHot-Spot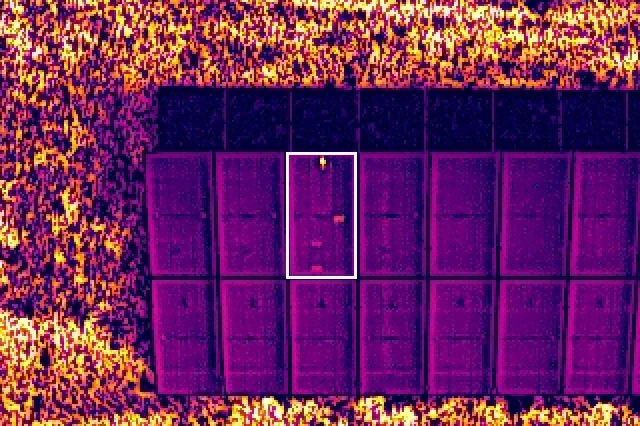 | Thermal | P3 → P1 |
Multiple hot cellsCell-Multi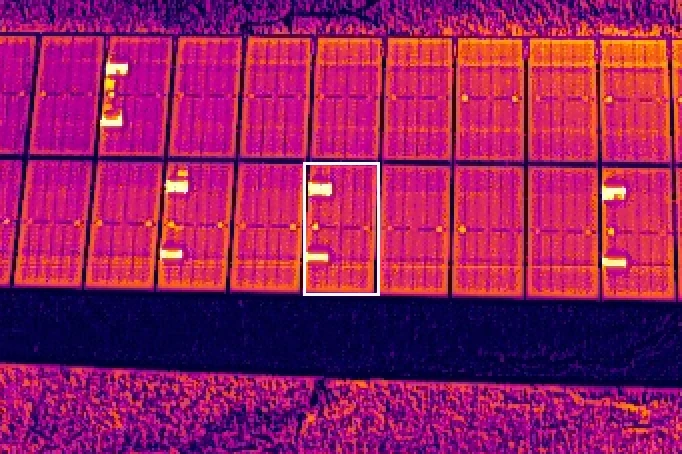 | Thermal | P3 → P1 |
Single diode / substringDiode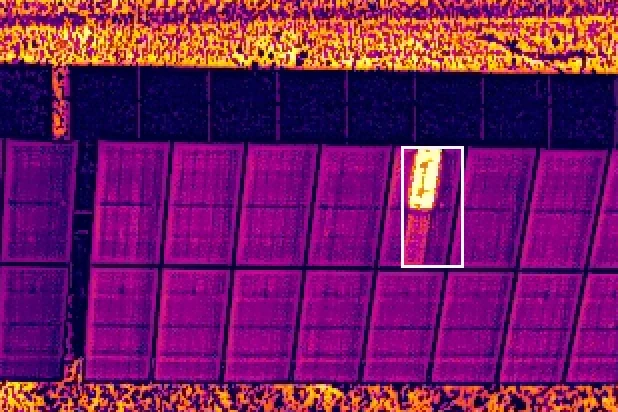 | Thermal | P2-P3 |
Multiple diodesDiode-Multi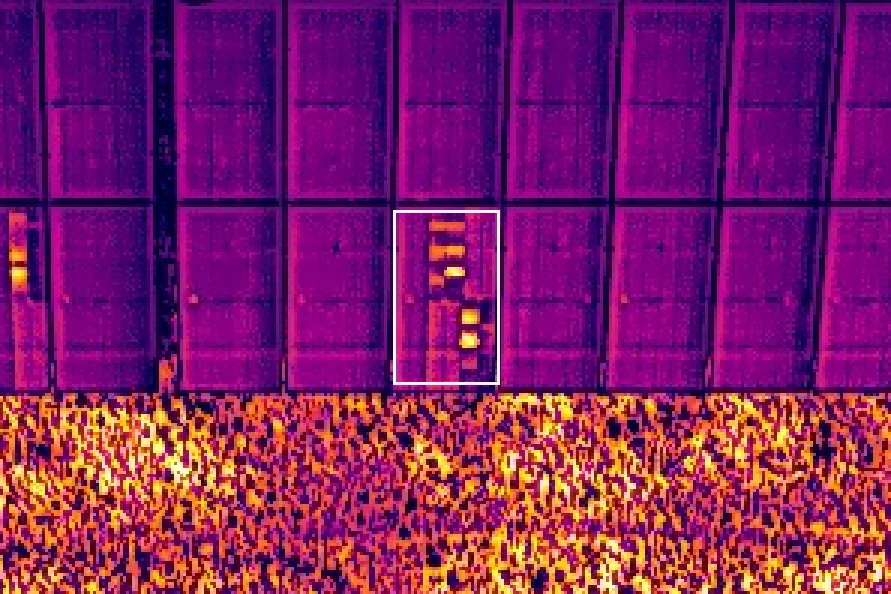 | Thermal | P2 |
Physical damagePhysical-Destruction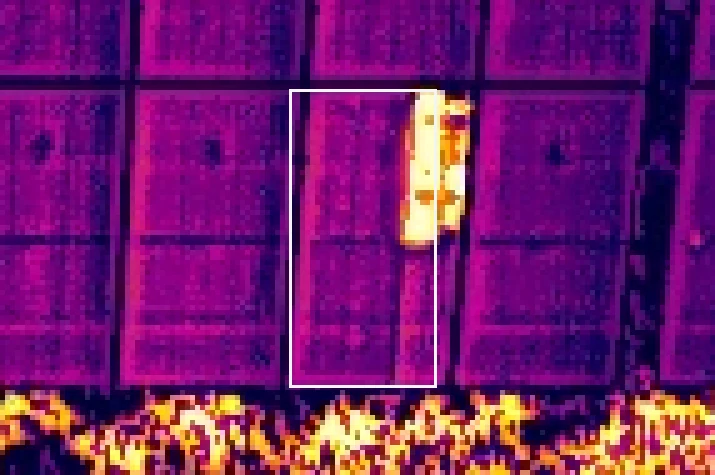 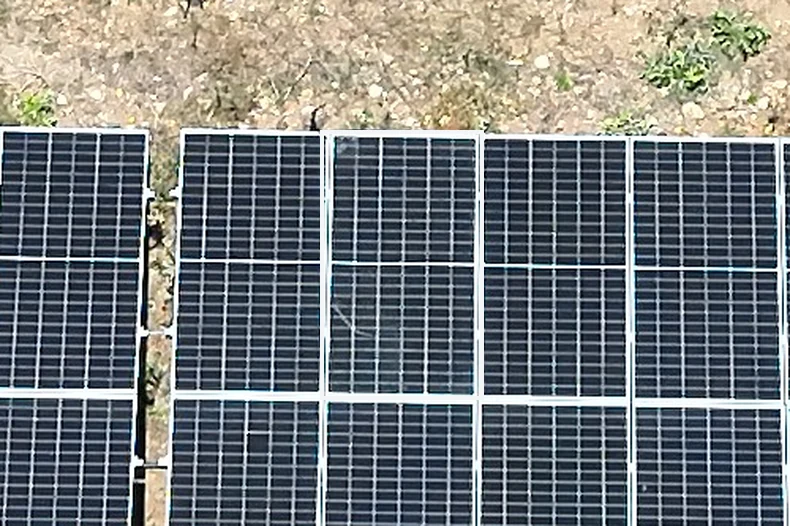 | RGB + thermal | P1 |
Offline moduleOffline-Module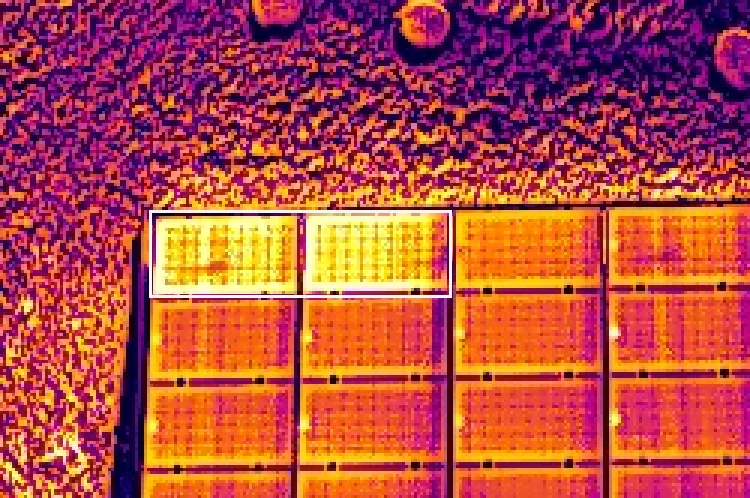 | Thermal | P2 |
String fault (3 or more consecutive modules)String-Fault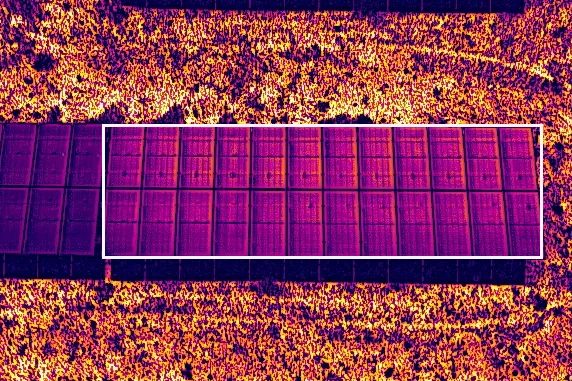 | Thermal | P2 · P1 if arcing |
Junction box / terminalJunction-Box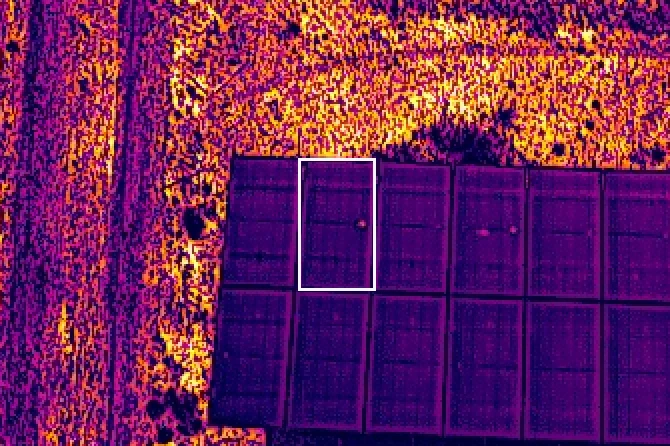 | Thermal | P1 |
Reversed polarityReversed-Polarity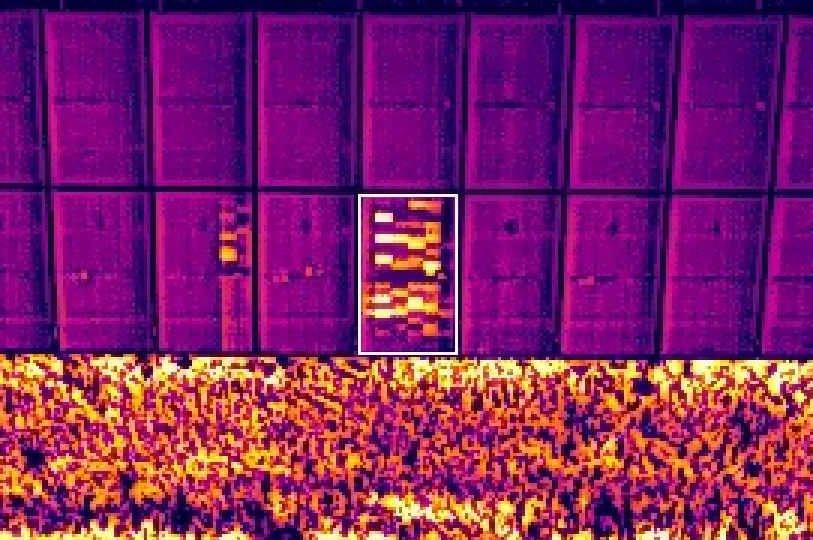 | Thermal | P1 |
Glass breakageGlass-Breakage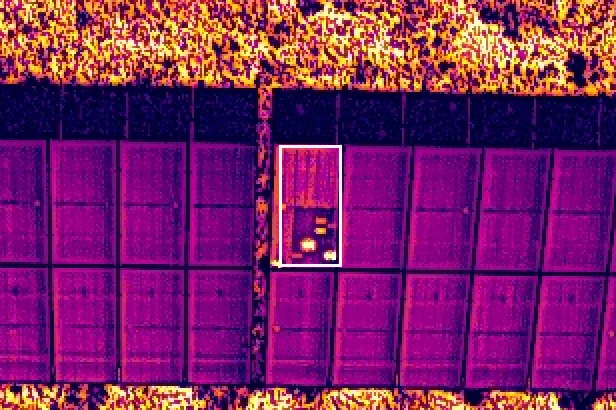 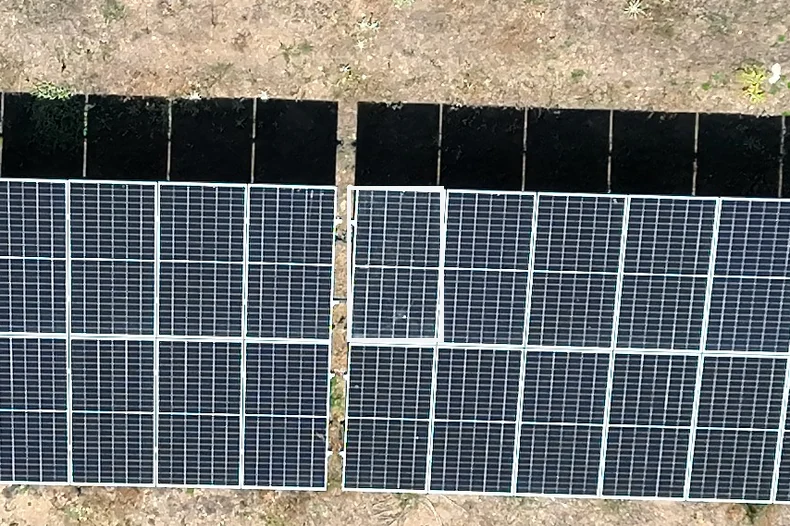 | RGB | P1 |
Missing / detached moduleMissing-Module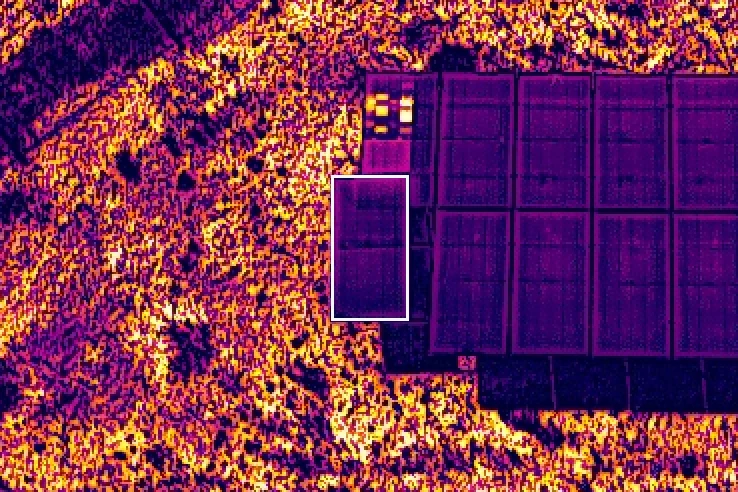 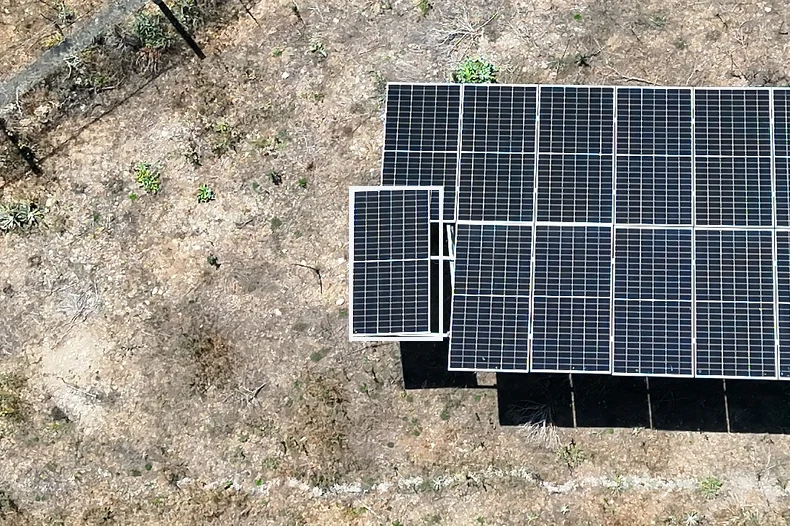 | RGB | P2 · P1 if hanging |
SoilingSoiling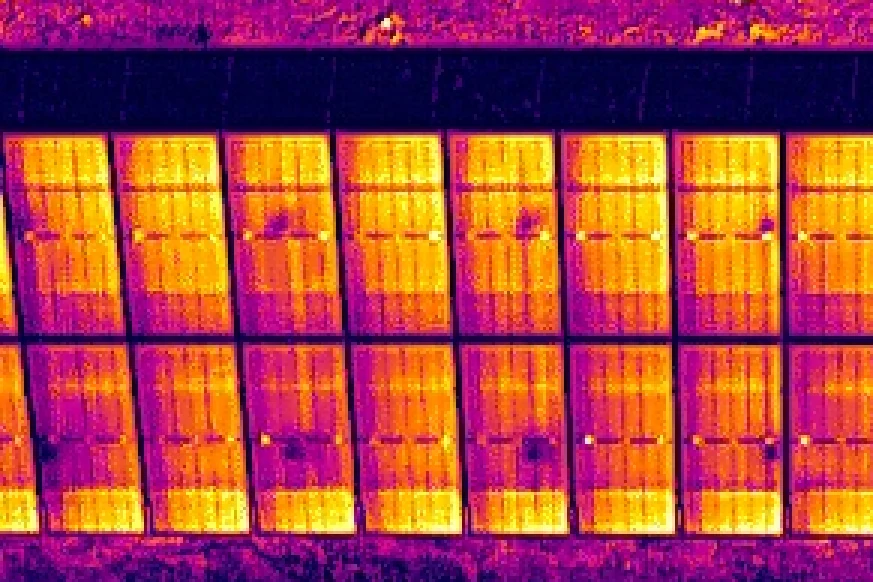 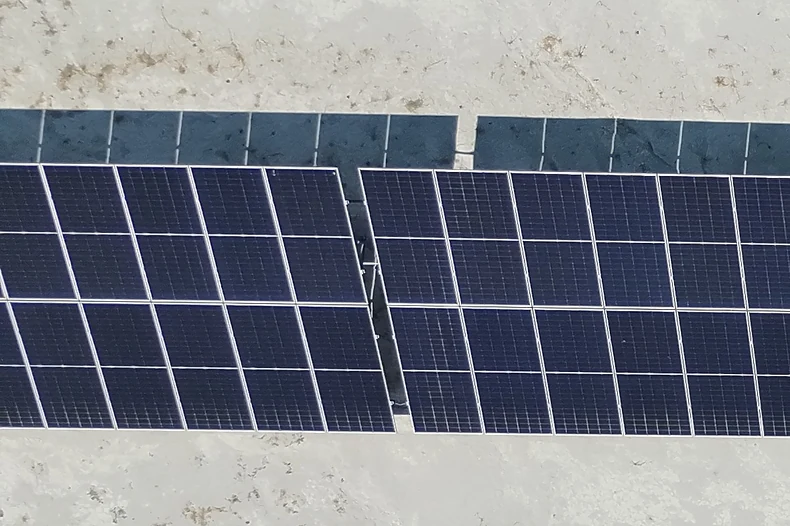 | RGB | P4 |
Bird droppingsBird-Droppings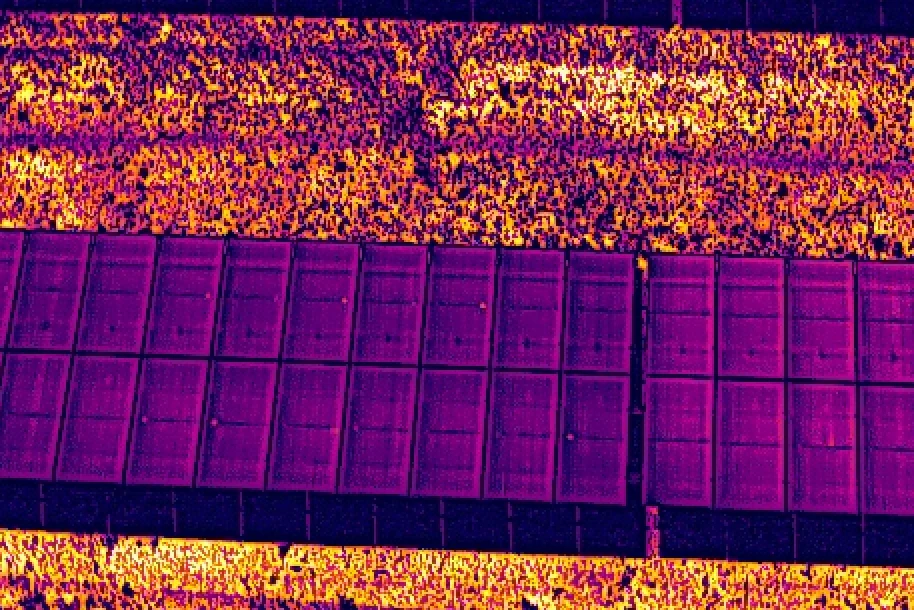 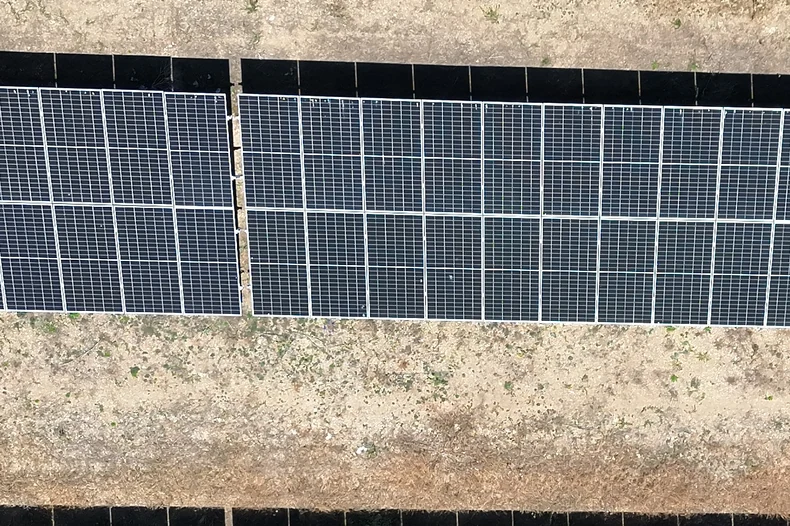 | RGB ≤1 cm/px | P4 |
Biological growthBiological-Growth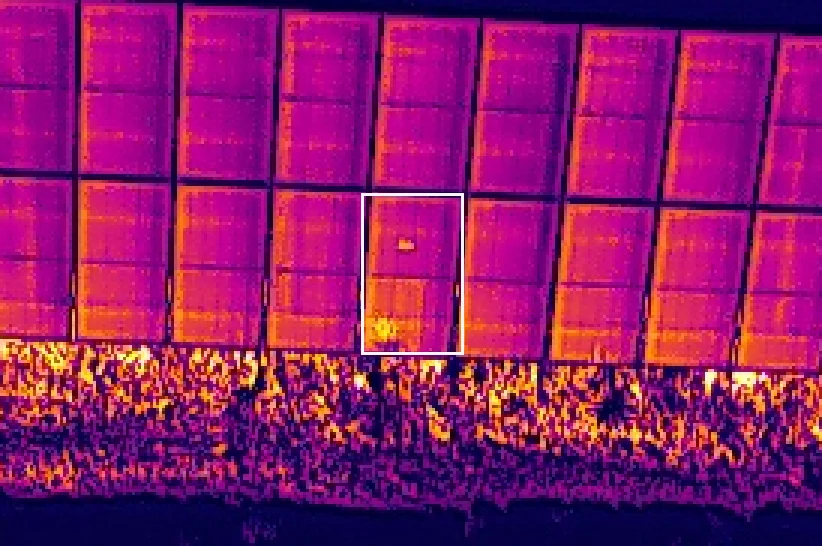 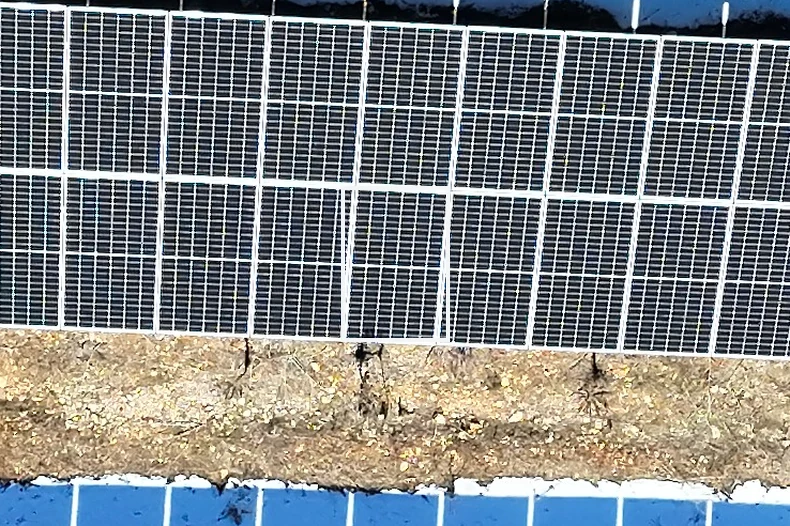 | RGB ≤1 cm/px | P4 |
Vegetation shadingVegetation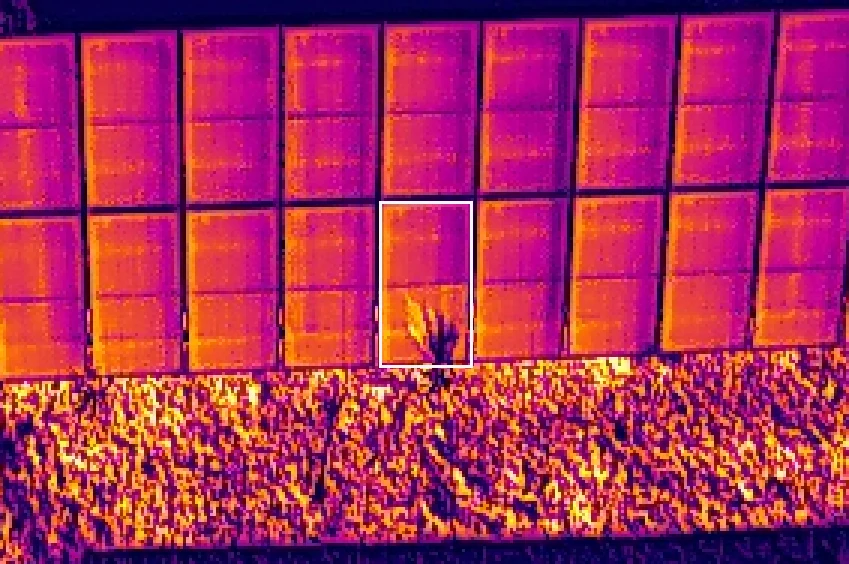 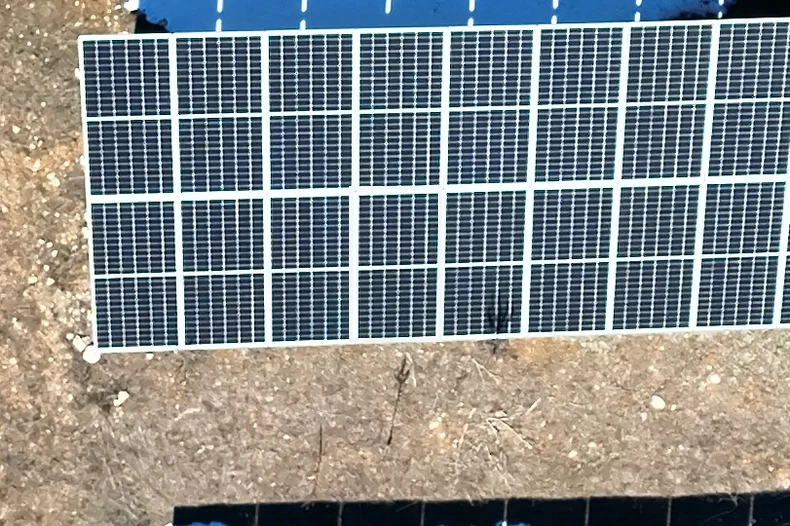 | RGB + thermal | P4 |
Structural shadingShadowing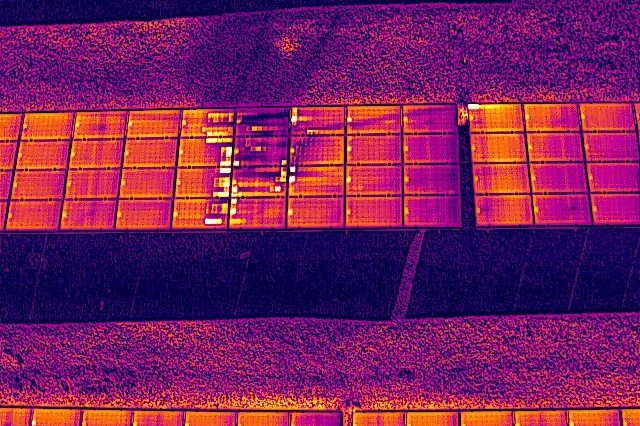 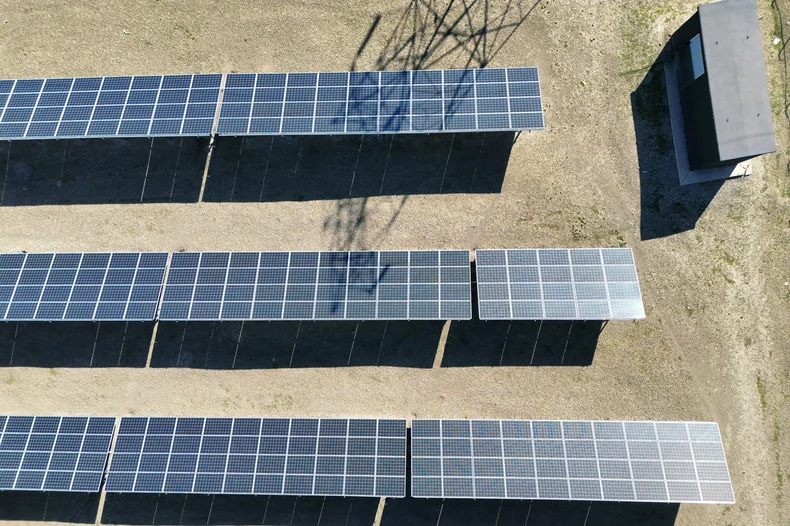 | RGB + geometry | P4 |
The priority order looks at safety as well as production loss. A burnt junction box and reversed polarity are P1 even where the loss is small. Classes that cannot be told apart with confidence from the image are flagged with a low confidence value.
Every panel's digital record
The platform is your plant's panel record. Every panel's identity, position and temperature history are kept in one place, and every flight is written onto the same record.
Fleet
- All plants on one screen: the date of the last flight, open findings and the priority distribution.
- Comparison across plants.
Map
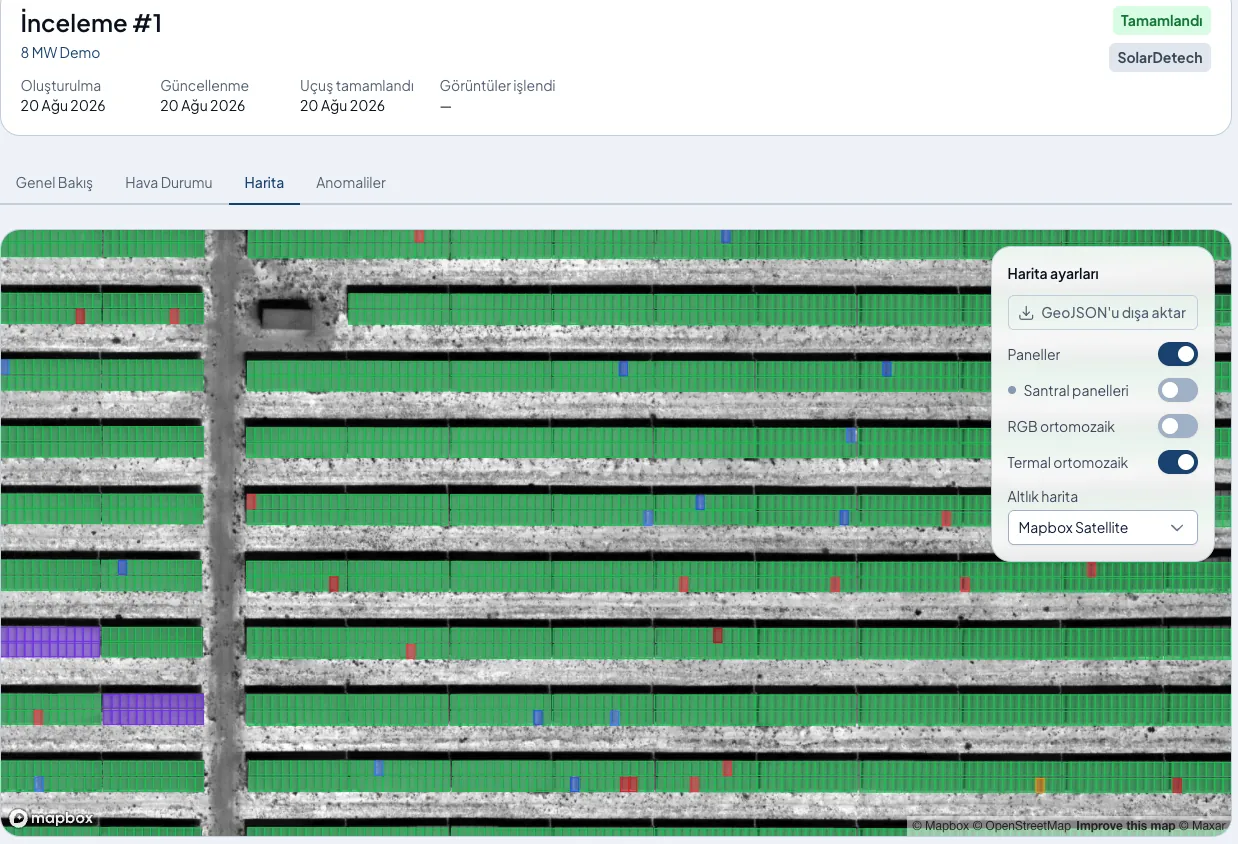
- Findings are shown on the plant map, with row, table, tier and column position.
- Thermal and RGB layers.
- You can drill down from a finding to the panel, and from the panel to the raw radiometric frame.
Panel record
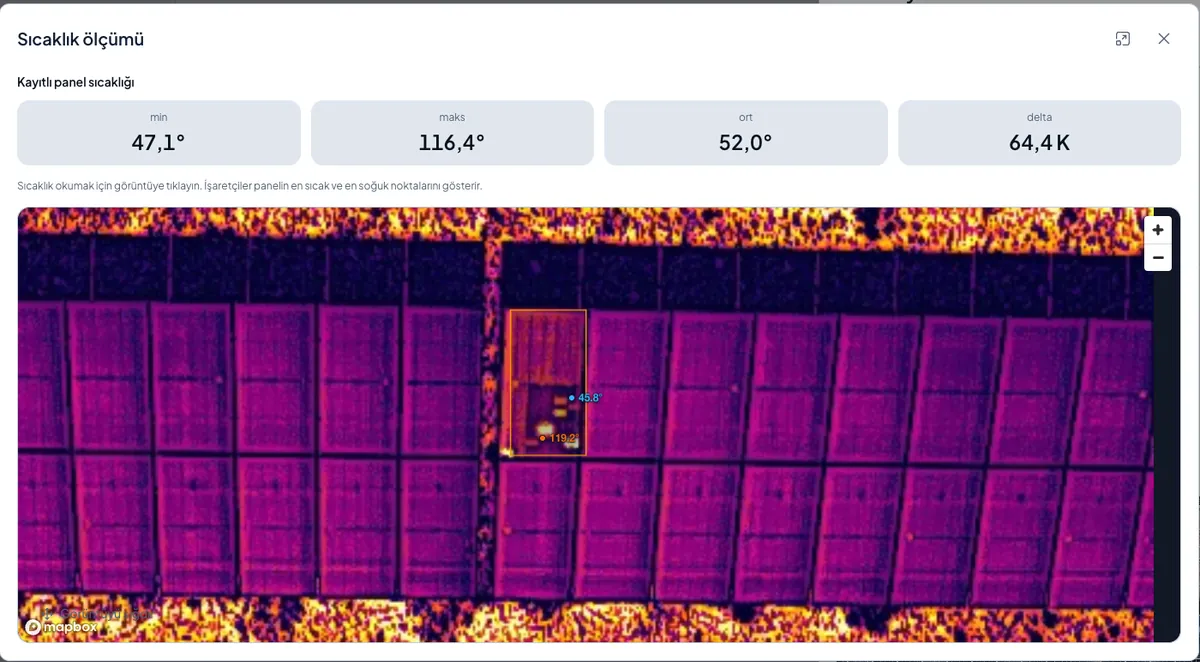
- A temperature history is kept for every module, from inspection to inspection.
- Flights from different dates are compared against the same threshold.
- New, growing and resolved anomalies are shown separately.
Action
- A work order from a finding: assignment, status and the closing note.
- Findings are ordered by priority and estimated production loss.
- A resolved anomaly closes on the same panel record at the next inspection.
Data
- The report is regenerated automatically on every change.
- One report is archived for every flight.
- There are separate user roles for the field team, the operator and the investor.
Request a quote
Send your plant's capacity and location. We reply within 24 hours with a rate-stamped quote.
The seven steps from flight to report are shown in order on the thermal drone inspection home page.