Methodology
The methodology of autonomous thermal inspection
The SolarDetech platform runs measurement and classification automatically, following the IEC TS 62446-3 methodology. The same three rules apply on every inspection, and the measurement conditions are documented in every report.
Three verification rules
A number without a source does not appear in the report. A finding based on a single frame does not enter the report either.
Based on measurement
A panel is not counted as anomalous unless it shows a measurable temperature difference from its neighbours. Measurements are normalised to irradiance.
Verified across many images
Every panel is assessed from many images taken from different angles. A finding is included in the report only when it is measured consistently in more than one image.
Every finding has a recorded source
For every finding in the report, the image and measurement it is based on are recorded. Where needed, the panel's temperature data can be examined down to pixel level.
Verification happens on the raw frame
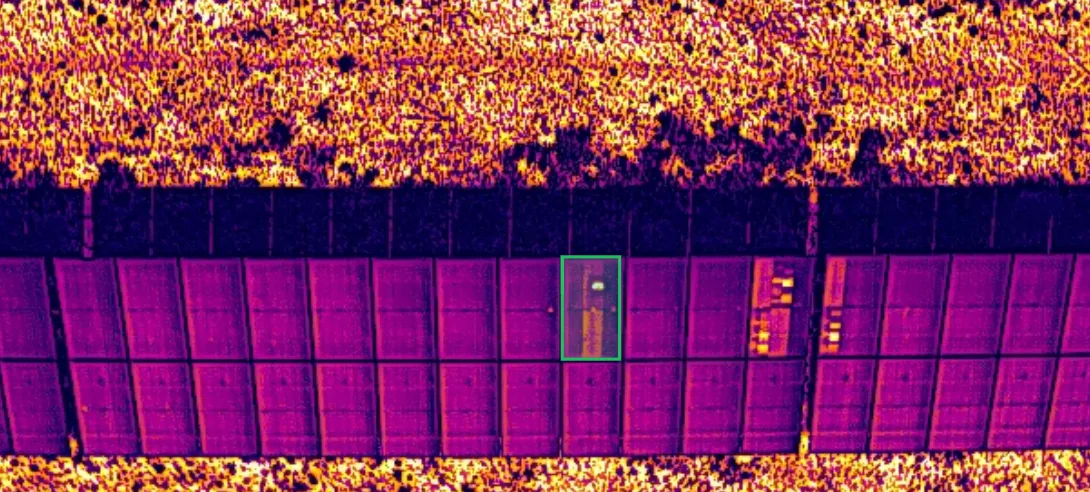
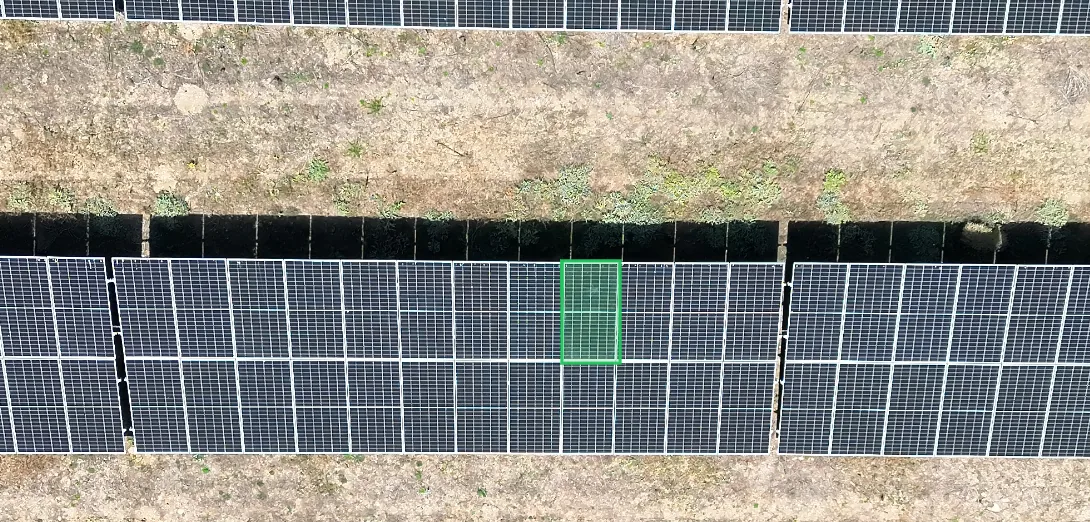
Findings are verified on the flight's raw thermal and RGB frames rather than on the orthomosaic. The panel card on the platform displays both frames at full resolution, with the panel marked by the same box in each.
Acceptance check
Before processing, the orthomosaic passes an automatic acceptance check on four points. The same criteria apply whether the flight was made by our field team or by yours. Data that misses the standard is not processed.
| Coverage | The whole site is on the map. |
|---|---|
| Row continuity | Panel rows join on the map without breaks. |
| Brightness uniformity | Brightness is consistent from frame to frame. |
| Edge crispness | Panel edges are sharply resolved. |
Measurement conditions are documented in the report
The irradiance and weather conditions of every flight are written into the report's own conditions section.
Flights are made on a clear day at no less than 600 W/m² irradiance. Measurements are taken under load from multiple images and normalised to irradiance.
at least 600 W/m²
Flight goes ahead
IEC TS 62446-3
Flown, measured and reported to IEC TS 62446-3.
Compliance is not a certificate. The measurement conditions are documented in every report.
IEC TS 62446-3 is the technical specification for outdoor infrared thermography of photovoltaic modules and plants. It sets the flight conditions, the image resolution, the measurement method, the anomaly classification and the structure of the report.
For current module formats (M10, G12), at least 5×5 pixels per cell are reached at 30 m. Classification and the report structure follow the specification.
Measurement and automation metrics
Measurement and anomaly detection run without human intervention. An expert confirms the class of every anomaly in the report. The time is approximate, for a 10 MW plant.
| Metric | Value |
|---|---|
| Share of panels measured with the thermal camera | 100% |
| Separate thermal frames each panel is seen in (median) | 15 |
| Share of panels verified in at least 10 separate thermal frames | 96.9% |
| Detected anomalies placed in the same main class as expert review | 99.5% |
| Automatic processing time for a 10 MW plant | about 12 hours |
| Report delivery | at most 5 business days after the data enters the system |
How the metrics were measured
The coverage and frame metrics were measured across SolarDetech's last four plant inspections. A panel counts as thermally measured when it was found in at least one thermal frame that shows it whole, not cut off at the frame edge; the frame count is the number of separate thermal frames in which the panel was found. Panels a flight cannot measure are listed separately in the report and are never counted as healthy.
How we measure accuracy
Most panels in a plant are healthy. For this reason a single "accuracy percentage" is misleading. Even a system that classed every panel as healthy would usually score above 95% panel-level accuracy. Such a figure reflects the high share of healthy panels rather than the system's ability to find anomalies.
We therefore measure classification and detection performance separately. In classification, 99.5% of detected anomalies fall in the same main class as expert review. An expert confirms the class of every anomaly in the report.
For detection performance we use two measures. Precision shows how many of the flagged panels really have an anomaly. Recall shows how many of the panels with a real anomaly get flagged.
Detection is measured on a plant the model never saw in training. Every panel in randomly selected tables is reviewed by an expert with the system's flags hidden. The evaluation is in progress. The results will be published on this page together with the number of panels measured and the confidence intervals.
Request a quote
Send us your panel count and plant location. We send our quote within 24 hours at most.